

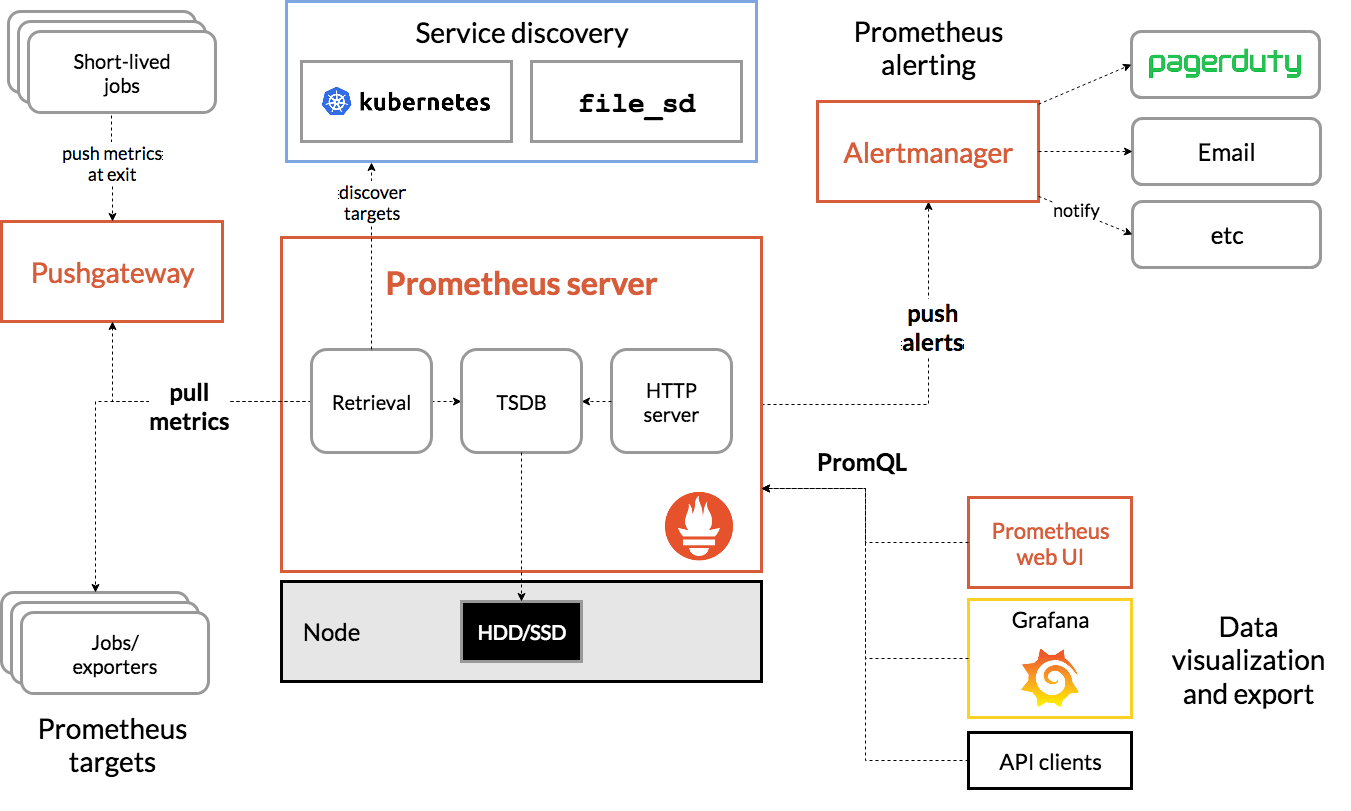
1. prometheus是什么
prometheus是一个具有活跃生态系统的开源系统监控和告警工具包。一言以蔽之,它是一套开源监控解决方案。
prometheus主要特性:
- 多维数据模型,其中包含由指标名称和键/值对标识的时间序列数据
- promql,一种灵活的查询语言
- 不依赖分布式存储; 单服务器节点是自治的
- 时间序列收集通过http上的pull模型进行
- 通过中间网关支持推送(push)时间序列
- 通过服务发现或静态配置发现目标
- 支持多种模式的图形和仪表盘
为什么用pull(拉取)而不用push(推送)呢?
因为,pull有以下优势:
- 进行更改时,可以在笔记本电脑上运行监控
- 可以更轻松地判断目标是否下线
- 可以手动转到目标并使用web浏览器检查其运行状况
目标暴露http端点,prometheus服务端通过http主动拉取数据。既然是服务端自己主动向目标拉取数据,那么服务端运行在本地(我们自己的电脑上)也是可以的,只要能访问目标端点即可,同时就像心跳检测一样可以判断目标是否下线,还有,服务端自己主动拉取,那么想拉取谁的数据就拉取谁的数据,因而可以随意切换拉取目标。
回想一下skywalking是怎么做的,skywalking有客户端和服务端,需要在目标服务上安装探针(agent),探针采集目标服务的指标数据,上报给服务端oap服务,这个对目标有一定的侵入性,不过可以接受。prometheus不需要探针,可以借助push gateway来实现push效果。
对了,有个名词要先说清楚,metrics (译:度量,指标),个人更倾向于把它翻译成指标,后面说指标就是metrics
2. 基本概念
2.1. 数据模型
prometheus基本上将所有数据存储为时间序列:具有时间戳的值流,它们属于同一个指标和同一组标记的维度。除了存储的时间序列外,prometheus还可以生成临时派生的时间序列作为查询的结果。
metric names and labels
every time series is uniquely identified by its metric name and optional key-value pairs called labels.
每个时间序列都由它的指标名称和称为标签的可选键/值对唯一标识。
样本构成实际的时间序列数据。 每个样本包括:
- 一个64位的浮点值
- 一个毫秒时间戳
给定指标名称和一组标签,时间序列通常使用这种符号来标识:
|
1
|
<metric name>{<label name>=<label value>, ...}
|
例如,有一个时间序列,指标名称是api_http_requests_total,标签有method="post"和handler="/messages",那么它可能被表示成这样:
|
1
|
api_http_requests_total{method="post", handler="/messages"}
|
2.2. 指标类型
counter
counter是一个累积量度,代表一个单调递增的计数器,其值只能增加或在重新启动时重置为零。例如,可以使用计数器来表示已服务请求数,已完成任务或错误的数量。
不要使用计数器来显示可以减小的值。例如,请勿对当前正在运行的进程数使用计数器,代替的应该使用量规。
gauge
量规是一种指标,代表可以任意上下波动的单个数值。
量规通常用于测量值,例如温度或当前内存使用量,还用于可能上升和下降的“计数”,例如并发请求数。
histogram
直方图对观察结果(通常是请求持续时间或响应大小)进行抽样,并在可配置的桶中对它们进行计数。它还提供了所有观测值的总和。
一个基础指标名称为<basename>的直方图在抓取期间会暴露多个时间序列:
- 观察桶的累积计数器,表示为 <basename>_bucket{le="<upper inclusive bound>"}
- 所有观测值的总和,表示为 <basename>_sum
- 观察到的事件数量,表示为 <basename>_count
summary
与直方图类似,摘要对观察结果(通常是请求持续时间和响应大小等内容)进行抽样分析。虽然它还提供了观测值的总数和所有观测值的总和,但它可以计算滑动时间窗口内的可配置分位数。
一个基础指标名称为<basename>的摘要在抓取期间暴露多个时间序列:
- 观察桶的累积计数器,表示为 <basename>_bucket{le="<upper inclusive bound>"}
- 所有观测值的总和,表示为 <basename>_sum
- 观察到的事件数量,表示为 <basename>_count
2.3. 作业和实例
在prometheus的术语中,可以抓取的端点称为实例,通常对应于单个进程。具有相同目的的实例集合,称为作业。
例如,一个作业有四个实例:
job: api-server
instance 1: 1.2.3.4:5670
instance 2: 1.2.3.4:5671
instance 3: 5.6.7.8:5670
instance 4: 5.6.7.8:5671
当prometheus抓取目标时,它会自动在抓取的时间序列上附加一些标签,以识别被抓取的目标:
- job:目标所属的已配置的作业名称
- instance:被抓取的目标url的<host>:<port>部分
3. 安装与配置

prometheus通过抓取指标http端点从目标收集指标。由于prometheus以相同的方式暴露自己的数据,因此它也可以抓取并监视其自身的健康状况。
默认情况下,不用更改配置,直接运行就可以抓取prometheus自身的健康状况数据
|
1
2
3
4
|
# start prometheus.
# by default, prometheus stores its database in ./data (flag --storage.tsdb.path)
./prometheus --config.file=prometheus.yml
|
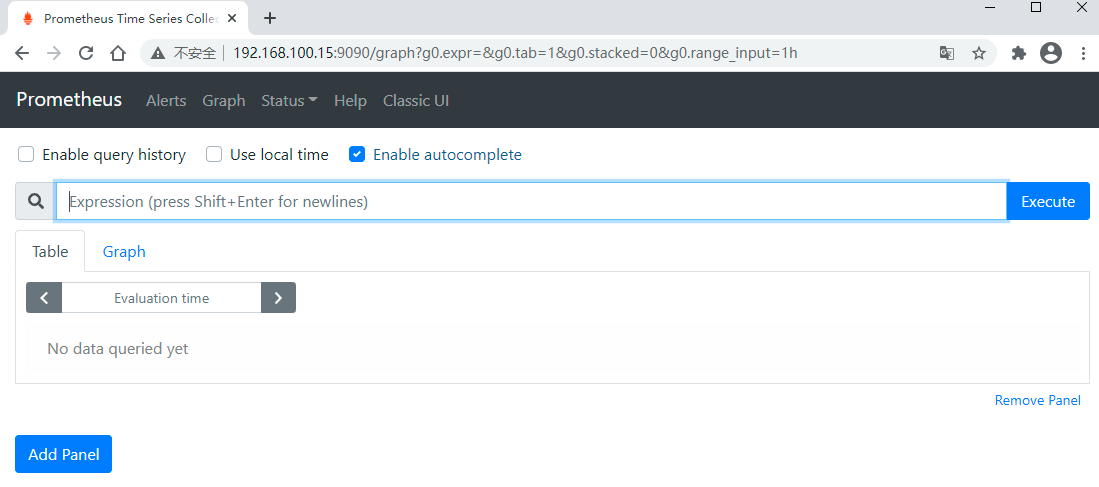
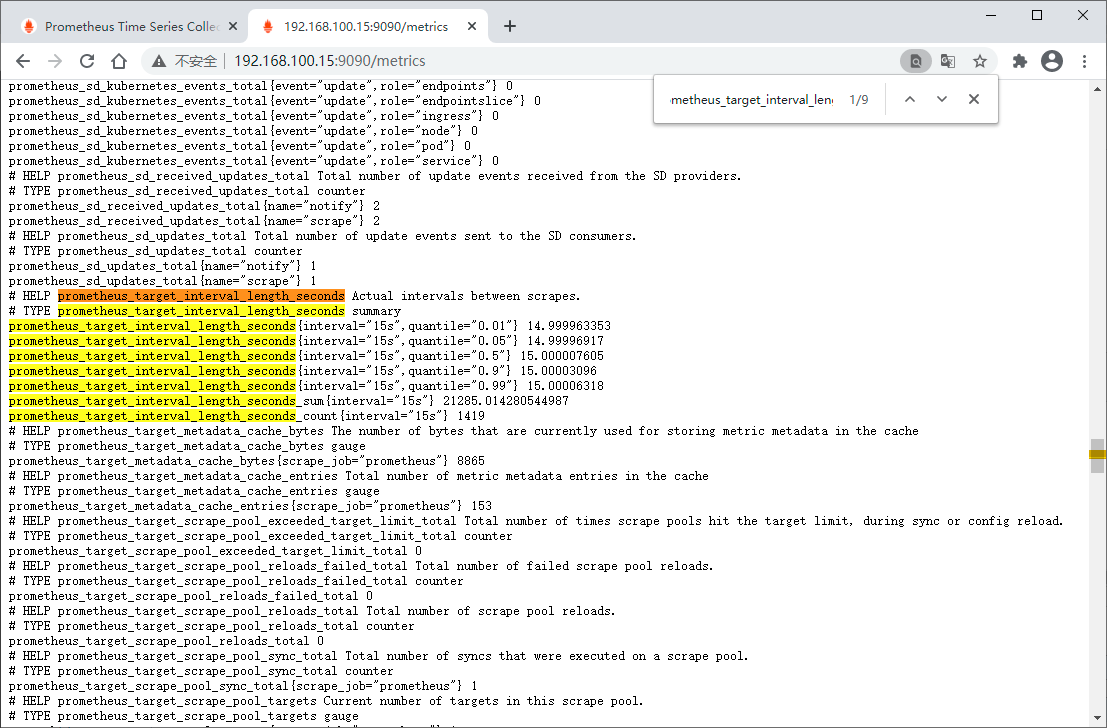
直接访问 localhost:9090
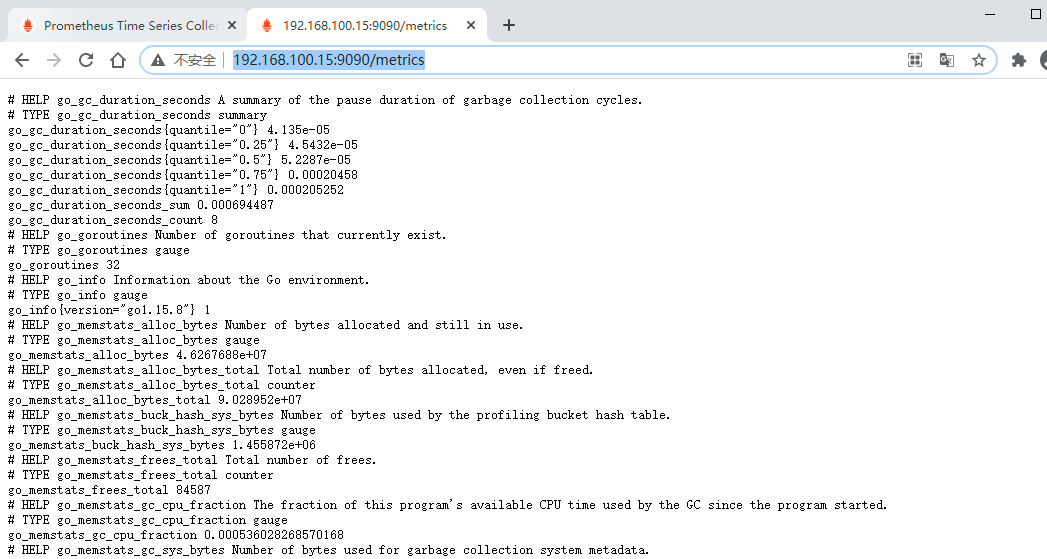
访问 localhost:9090/metrics 可以查看各项指标
举个例子
输入以下表达式,点“execute”,可以看到以下效果
|
1
|
prometheus_target_interval_length_seconds
|
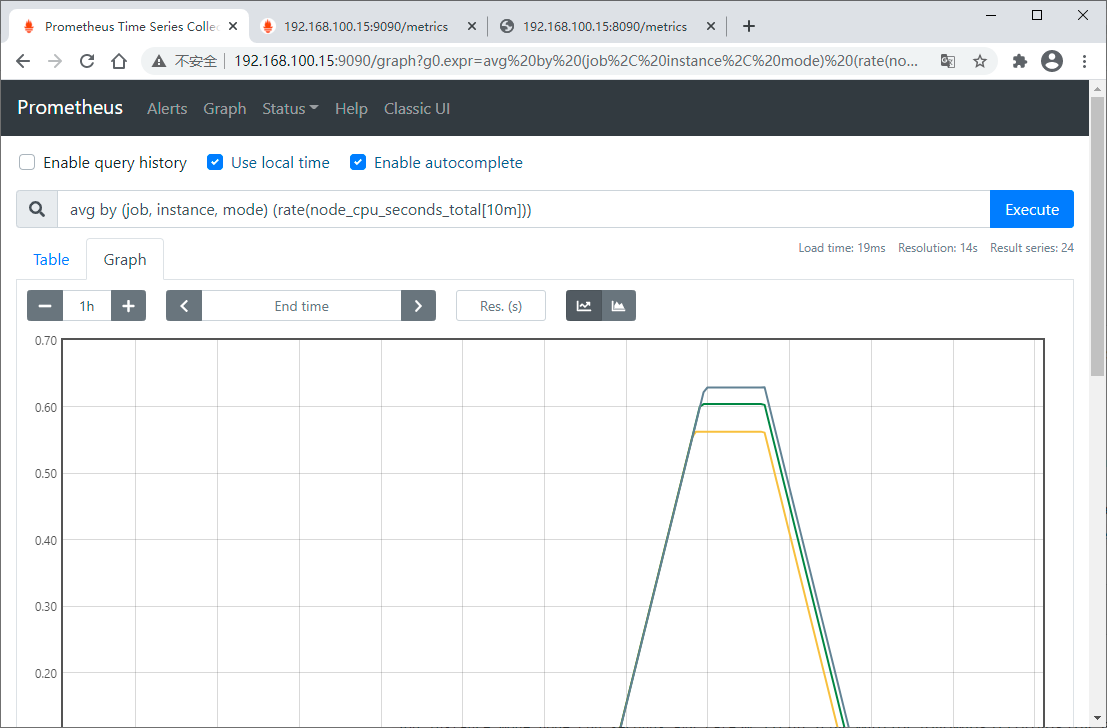
这应该返回多个不同的时间序列(以及每个序列的最新值),每个序列的指标名称均为prometheus_target_interval_length_seconds,但具有不同的标签。
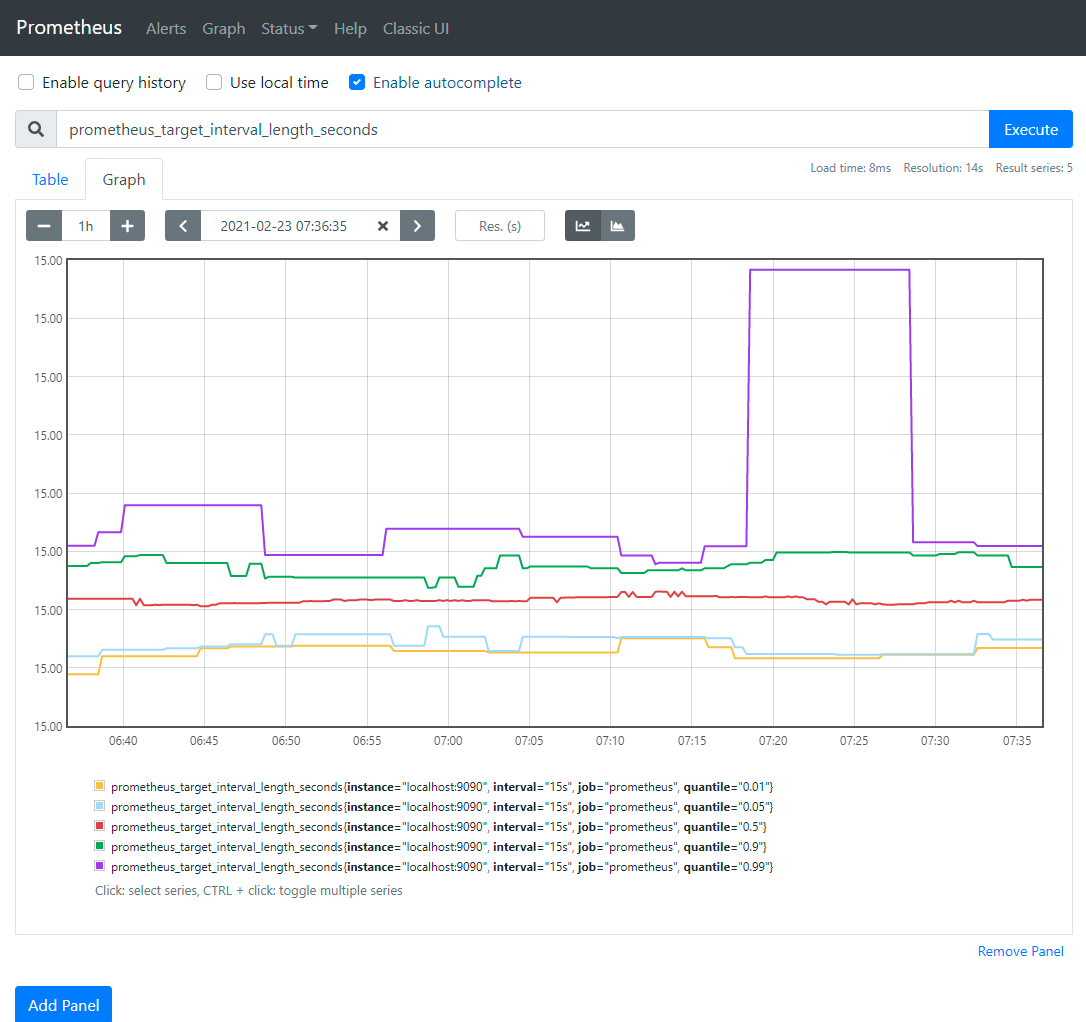
这个是以图形化的方式展示指标,通过localhost:9090/metrics查看也是一样的
如果我们只对99%的延迟感兴趣,我们可以使用以下查询:
|
1
|
prometheus_target_interval_length_seconds{quantile="0.99"}
|
为了计算返回的时间序列数,查询应该这样写:
|
1
|
count(prometheus_target_interval_length_seconds)
|
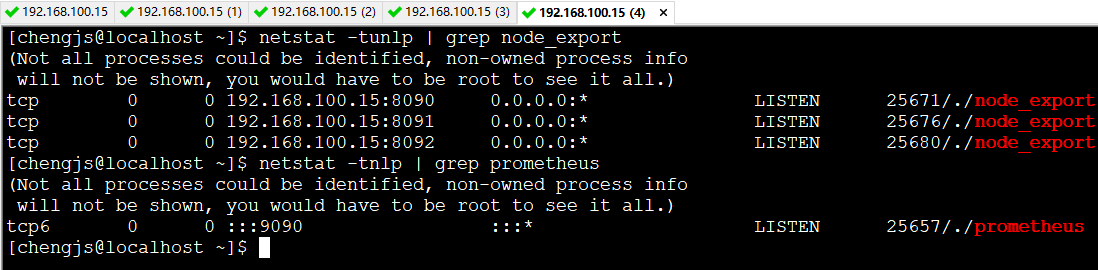
接下来,让我们利用node exporter来多添加几个目标:
|
1
2
3
4
5
6
7
|
tar -xzvf node_exporter-*.*.tar.gz
cd node_exporter-*.*
# start 3 example targets in separate terminals:
./node_exporter --web.listen-address 127.0.0.1:8080
./node_exporter --web.listen-address 127.0.0.1:8081
./node_exporter --web.listen-address 127.0.0.1:8082
|
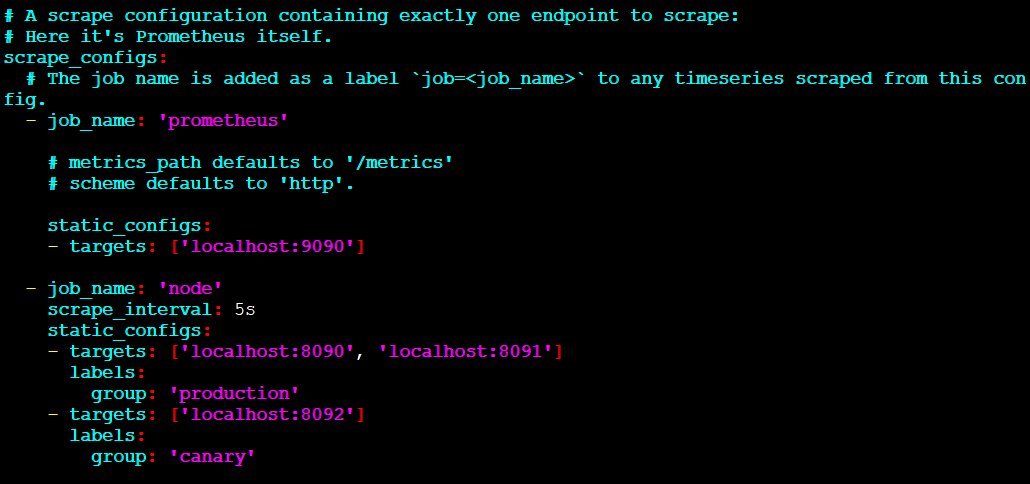
接下来,配置prometheus来抓取这三个新目标
首先,定义一个名为'node'的作业,这个作业负责从这三个目标端点抓取数据。假设,想象前两个端点是生产环境的,另一个是非生产环境的,为了以示区别,我们将其打上两个不同的标签。在本示例中,我们将group="production"标签添加到第一个目标组,同时将group="canary"添加到第二个目标。
|
1
2
3
4
5
6
7
8
9
10
11
12
13
14
|
scrape_configs:
- job_name: 'node'
# override the global default and scrape targets from this job every 5 seconds.
scrape_interval: 5s
static_configs:
- targets: ['localhost:8080', 'localhost:8081']
labels:
group: 'production'
- targets: ['localhost:8082']
labels:
group: 'canary'
|
3.1. 配置
为了查看所有的命令行参数,运行如下命令
|
1
|
./prometheus -h
|
配置文件是yaml格式的,可以使用 –config.file参数指定
配置文件的主要结构如下:
|
1
2
3
4
5
6
7
8
9
10
11
12
13
14
15
16
17
18
19
20
21
22
23
24
25
26
27
28
29
30
31
32
33
34
35
36
37
38
39
40
41
42
|
global:
# how frequently to scrape targets by default.
[ scrape_interval: <duration> | default = 1m ]
# how long until a scrape request times out.
[ scrape_timeout: <duration> | default = 10s ]
# how frequently to evaluate rules.
[ evaluation_interval: <duration> | default = 1m ]
# the labels to add to any time series or alerts when communicating with
# external systems (federation, remote storage, alertmanager).
external_labels:
[ <labelname>: <labelvalue> ... ]
# file to which promql queries are logged.
# reloading the configuration will reopen the file.
[ query_log_file: <string> ]
# rule files specifies a list of globs. rules and alerts are read from
# all matching files.
rule_files:
[ - <filepath_glob> ... ]
# a list of scrape configurations.
scrape_configs:
[ - <scrape_config> ... ]
# alerting specifies settings related to the alertmanager.
alerting:
alert_relabel_configs:
[ - <relabel_config> ... ]
alertmanagers:
[ - <alertmanager_config> ... ]
# settings related to the remote write feature.
remote_write:
[ - <remote_write> ... ]
# settings related to the remote read feature.
remote_read:
[ - <remote_read> ... ]
|
4. 抓取 spring boot 应用
prometheus希望抓取或轮询单个应用程序实例以获取指标。 spring boot在 /actuator/prometheus 提供了一个actuator端点,以适当的格式提供prometheus抓取。
为了以prometheus服务器可以抓取的格式公开指标,需要依赖 micrometer-registry-prometheus
|
1
2
3
4
5
|
<dependency>
<groupid>io.micrometer</groupid>
<artifactid>micrometer-registry-prometheus</artifactid>
<version>1.6.4</version>
</dependency>
|
下面是一个示例 prometheus.yml
|
1
2
3
4
5
|
scrape_configs:
- job_name: 'spring'
metrics_path: '/actuator/prometheus'
static_configs:
- targets: ['host:port']
|
接下来,创建一个项目,名为prometheus-example
pom.xml
|
1
2
3
4
5
6
7
8
9
10
11
12
13
14
15
16
17
18
19
20
21
22
23
24
25
26
27
28
29
30
31
32
33
34
35
36
37
38
39
40
41
42
43
44
45
|
<?xml version="1.0" encoding="utf-8"?>
<project xmlns="http://maven.apache.org/pom/4.0.0" xmlns:xsi="http://www.w3.org/2001/xmlschema-instance"
xsi:schemalocation="http://maven.apache.org/pom/4.0.0 https://maven.apache.org/xsd/maven-4.0.0.xsd">
<modelversion>4.0.0</modelversion>
<parent>
<groupid>org.springframework.boot</groupid>
<artifactid>spring-boot-starter-parent</artifactid>
<version>2.4.3</version>
<relativepath/> <!-- lookup parent from repository -->
</parent>
<groupid>com.cjs.example</groupid>
<artifactid>prometheus-example</artifactid>
<version>0.0.1-snapshot</version>
<name>prometheus-example</name>
<description>demo project for spring boot</description>
<properties>
<java.version>1.8</java.version>
</properties>
<dependencies>
<dependency>
<groupid>org.springframework.boot</groupid>
<artifactid>spring-boot-starter-actuator</artifactid>
</dependency>
<dependency>
<groupid>org.springframework.boot</groupid>
<artifactid>spring-boot-starter-web</artifactid>
</dependency>
<dependency>
<groupid>io.micrometer</groupid>
<artifactid>micrometer-registry-prometheus</artifactid>
<scope>runtime</scope>
</dependency>
</dependencies>
<build>
<plugins>
<plugin>
<groupid>org.springframework.boot</groupid>
<artifactid>spring-boot-maven-plugin</artifactid>
</plugin>
</plugins>
</build>
</project>
|
application.yml
|
1
2
3
4
5
6
7
8
9
10
11
|
spring:
application:
name: prometheus-example
management:
endpoints:
web:
exposure:
include: "*"
metrics:
tags:
application: ${spring.application.name}
|
这句别忘了:management.metrics.tags.application=${spring.application.name}
spring bootactuator 默认的端点很多,详见
https://docs.spring.io/spring-boot/docs/2.4.3/reference/html/production-ready-features.html
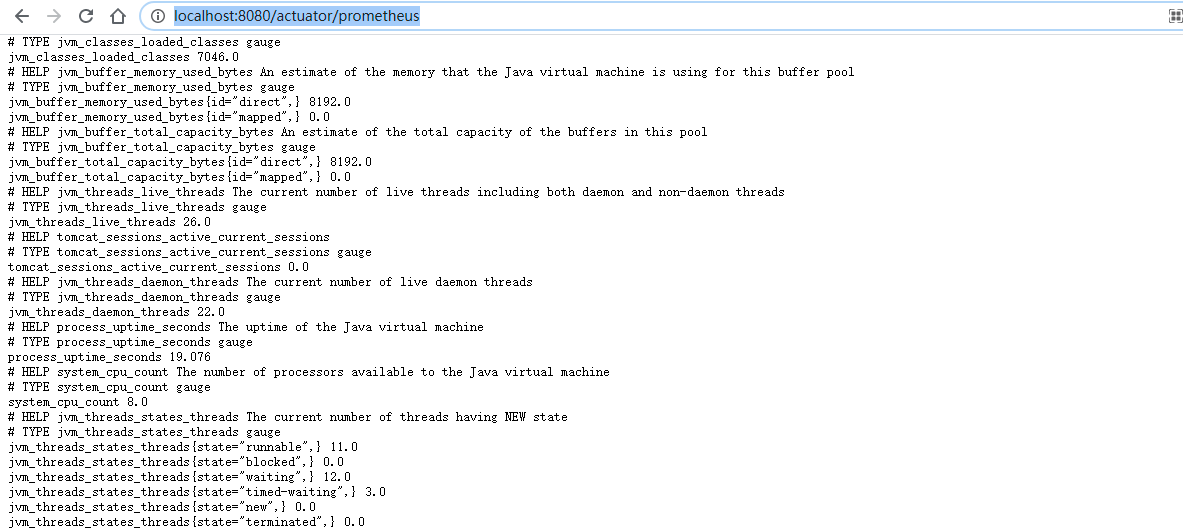
启动项目,浏览器访问/actuator/prometheus 端点
配置prometheus抓取该应用
|
1
2
3
4
5
6
7
8
9
10
11
12
|
scrape_configs:
# the job name is added as a label `job=<job_name>` to any timeseries scraped from this config.
- job_name: 'prometheus'
# metrics_path defaults to '/metrics'
# scheme defaults to 'http'.
static_configs:
- targets: ['localhost:9090']
- job_name: 'springboot-prometheus'
metrics_path: '/actuator/prometheus'
static_configs:
- targets: ['192.168.100.93:8080']
|
重启服务
|
1
|
./prometheus --config.file=prometheus.yml
|

4.1. grafana
https://grafana.com/docs/
https://grafana.com/tutorials/
下载&解压
|
1
2
|
wget https://dl.grafana.com/oss/release/grafana-7.4.3.linux-amd64.tar.gz
tar -zxvf grafana-7.4.3.linux-amd64.tar.gz
|
启动
|
1
|
./bin/grafana-server web
|
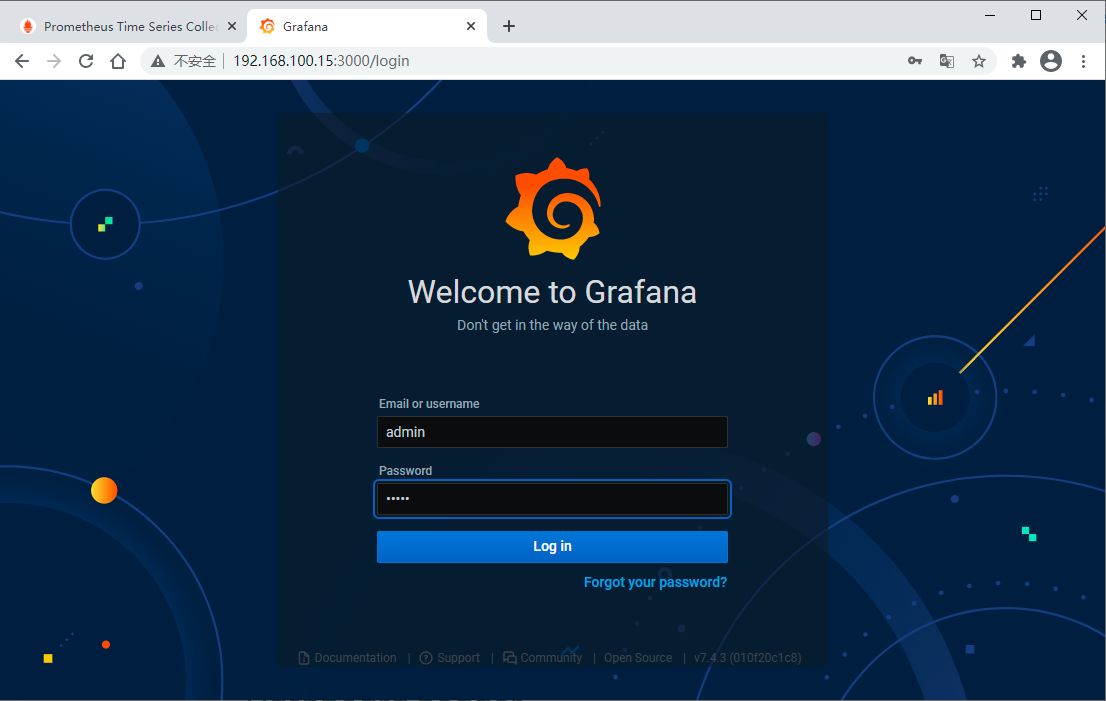
浏览器访问 http://localhost:3000
默认账号是 admin/admin
首次登陆后我们将密码改成admin1234
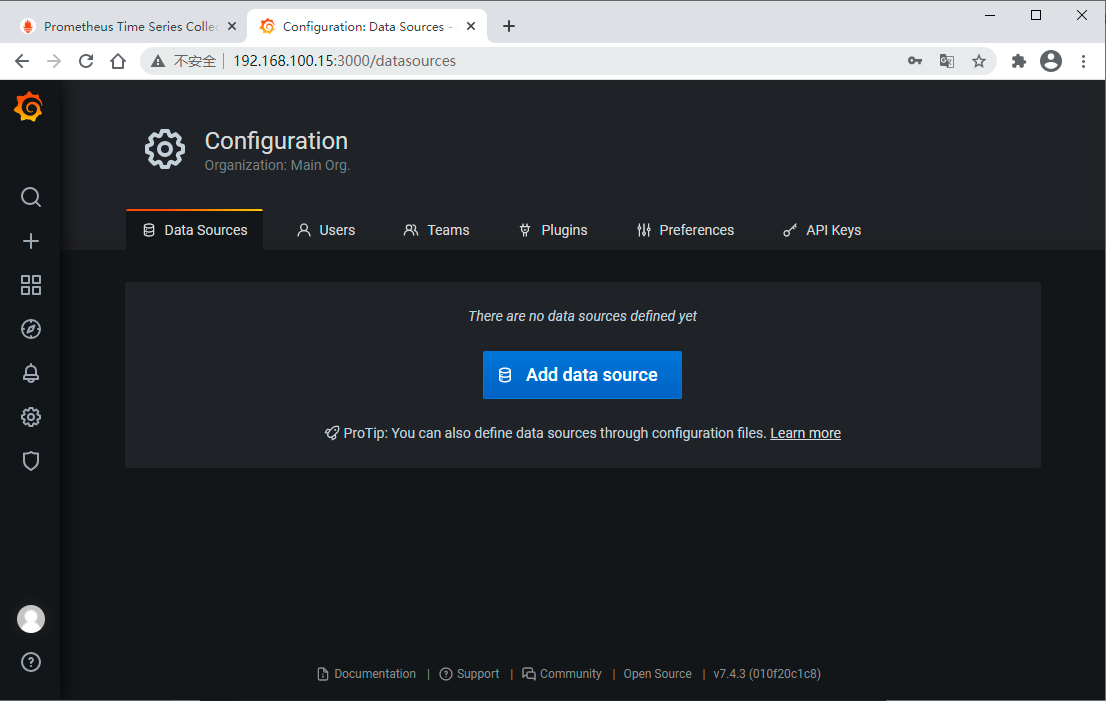
先配置一个数据源,一会儿添加仪表盘的时候要选择数据源的

grafana官方提供了很多模板,我们可以直接使用
首先要找到我们想要的模板
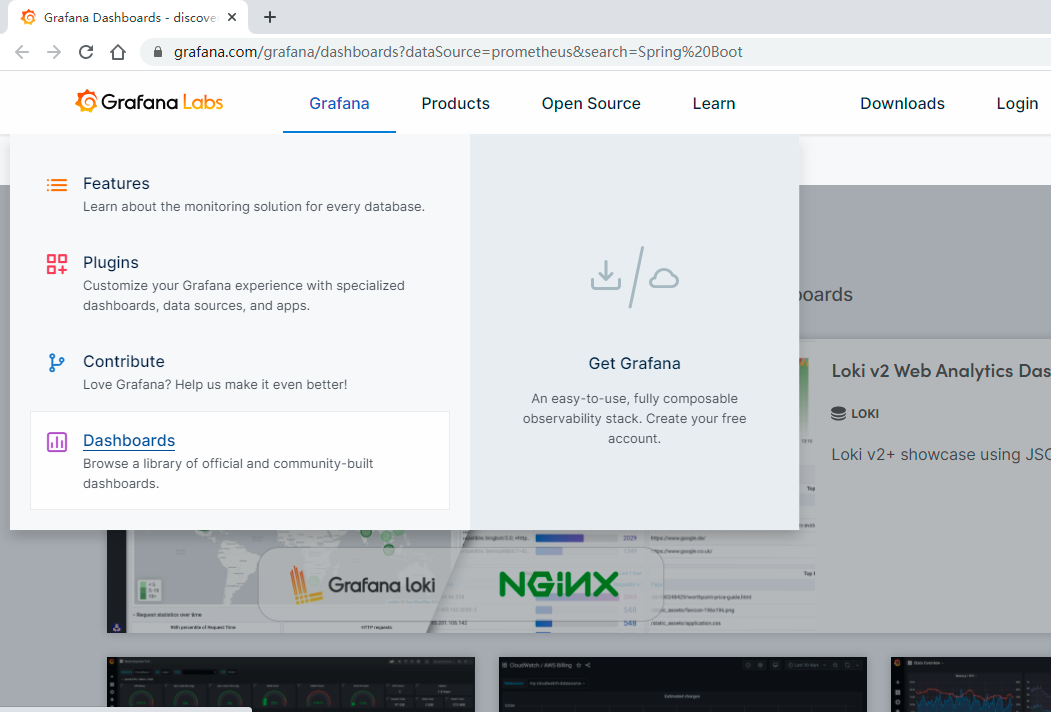
比如,我们这里随便选了一个模板
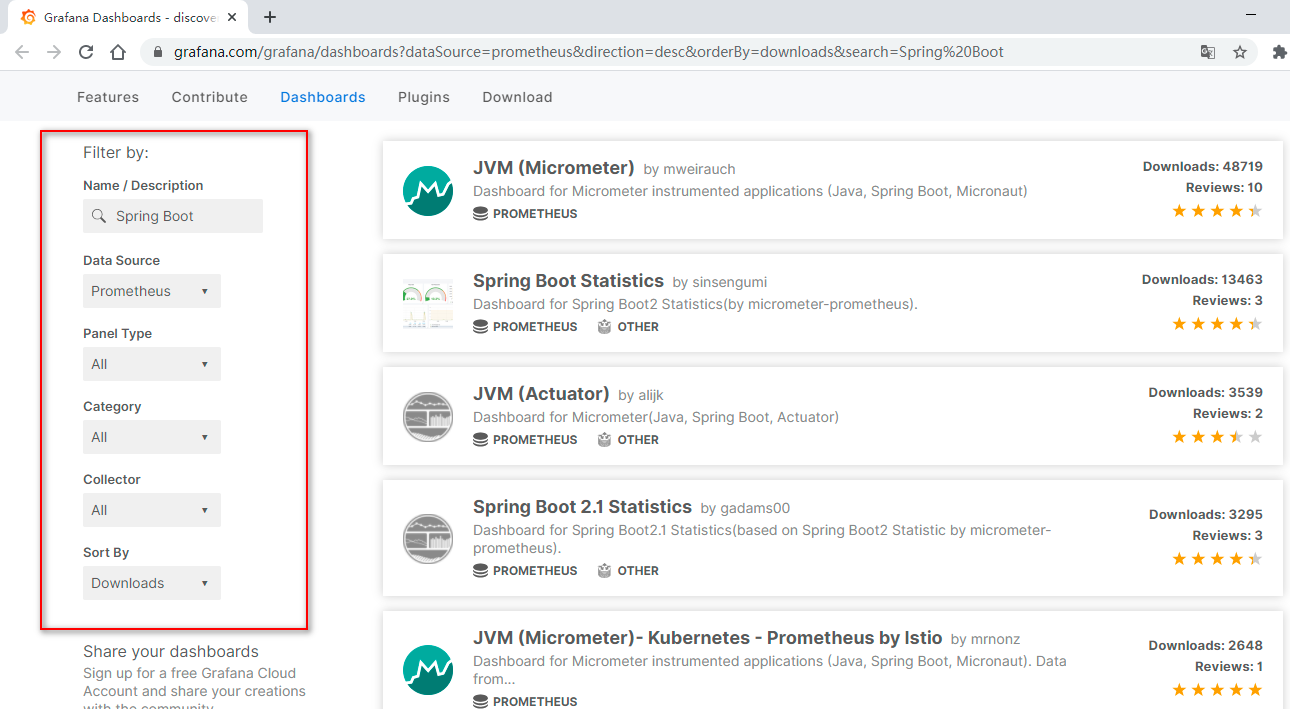

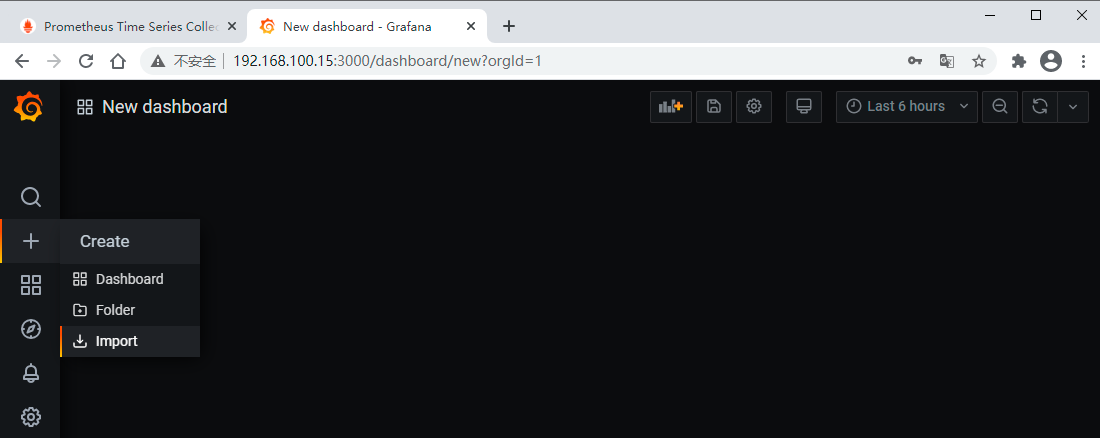
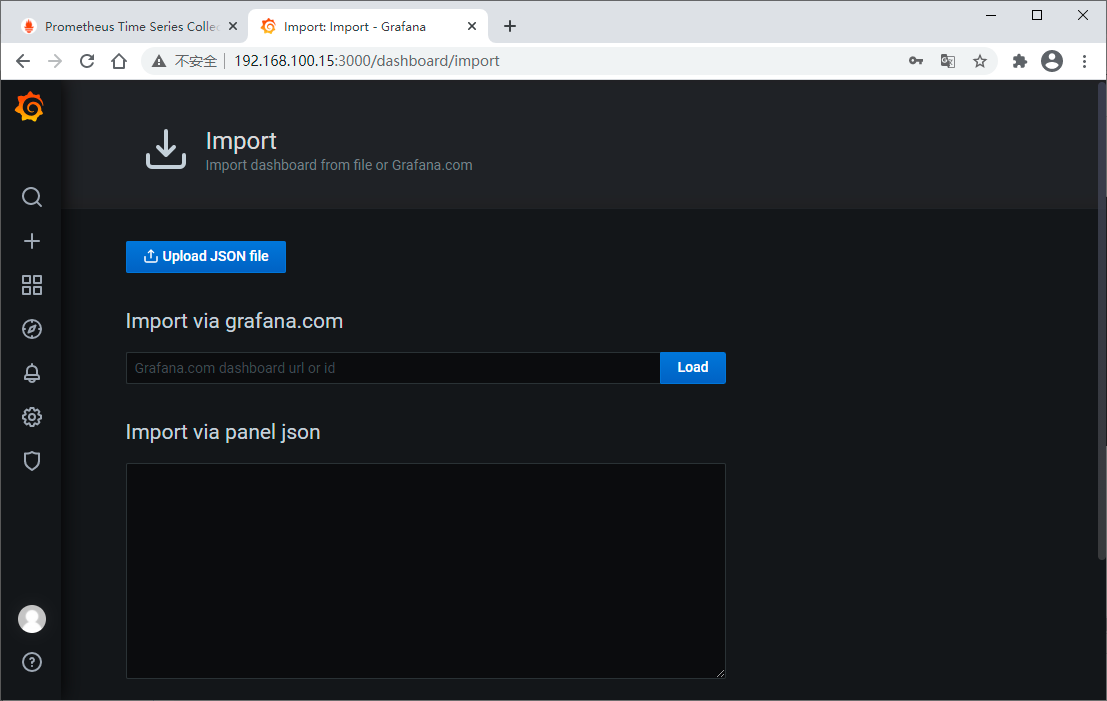
可以直接将模板json文件下载下来导入,也可以直接输入模板id加载,这里我们直接输入模板id
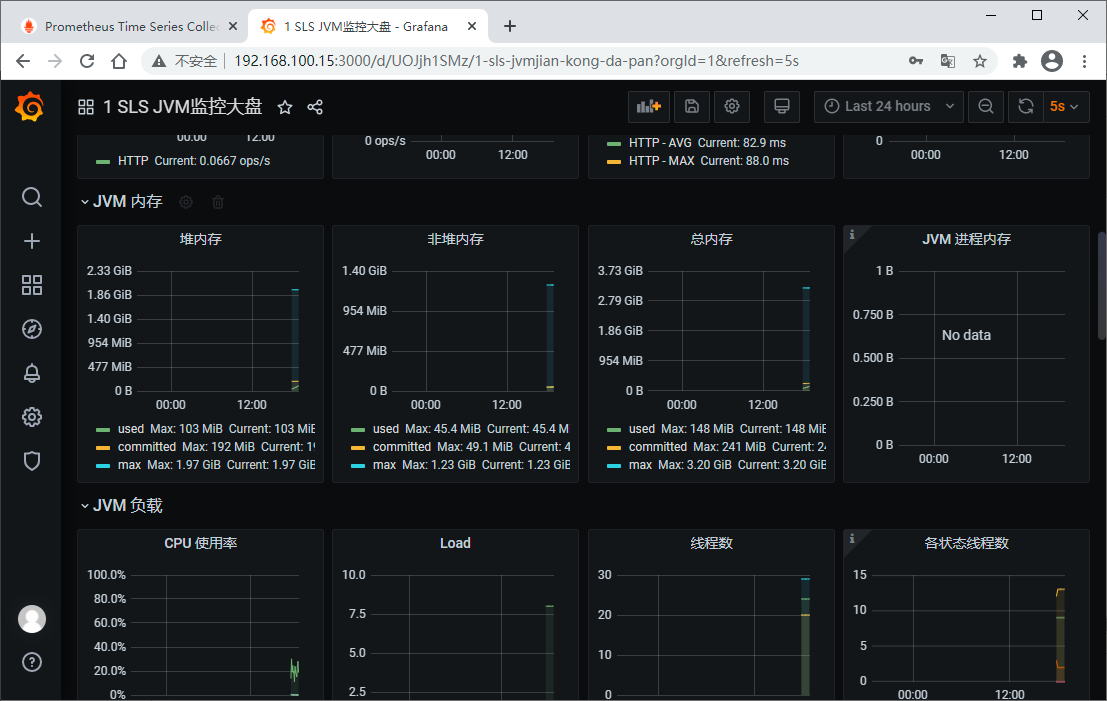
立竿见影,马上就看到漂亮的展示界面了

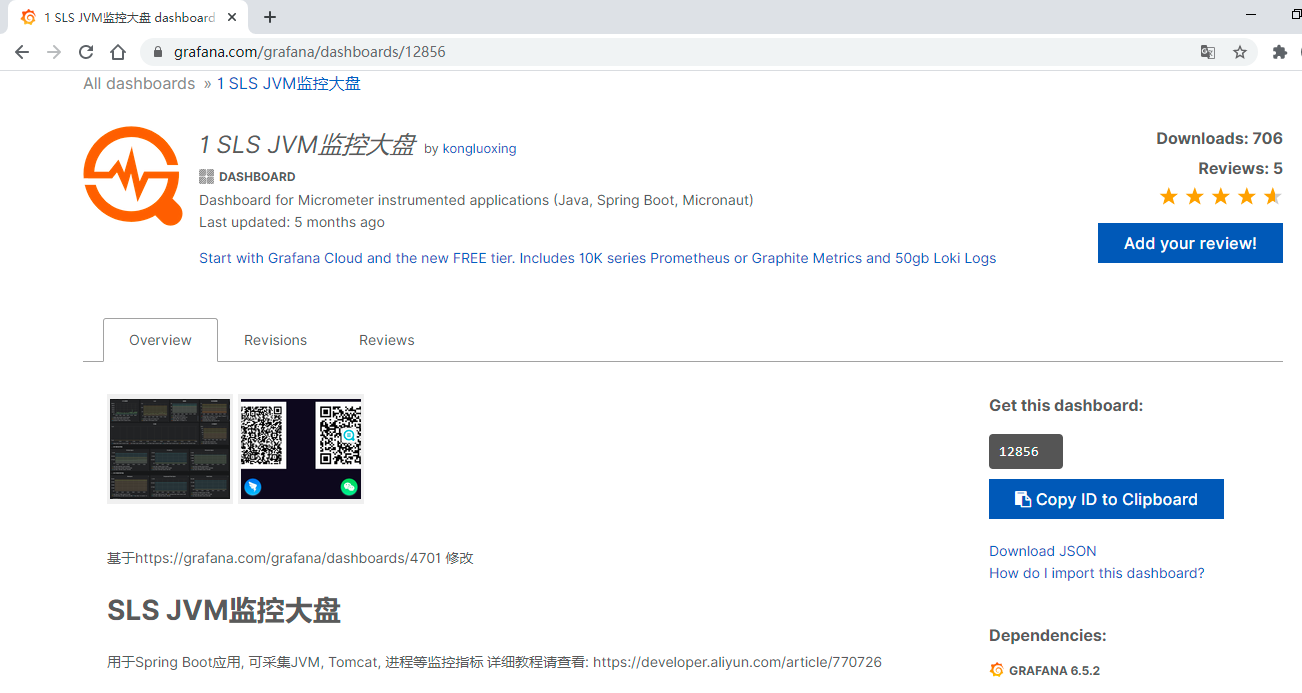
我们再添加一个dashboard (id:12856)
到此这篇关于prometheus + spring boot 应用监控的文章就介绍到这了,更多相关prometheus + spring boot 应用监控内容请搜索快网idc以前的文章或继续浏览下面的相关文章希望大家以后多多支持快网idc!
原文链接:https://www.cnblogs.com/cjsblog/p/14434883.html

相关文章


- ASP.NET本地开发时常见的配置错误及解决方法? 2025-06-10
- ASP.NET自助建站系统的数据库备份与恢复操作指南 2025-06-10
- 个人网站服务器域名解析设置指南:从购买到绑定全流程 2025-06-10
- 个人网站搭建:如何挑选具有弹性扩展能力的服务器? 2025-06-10
- 个人服务器网站搭建:如何选择适合自己的建站程序或框架? 2025-06-10