

首先先看一下效果:
一、创建饼状图对象
创建饼状图对象用到类是piechartview.h, 代码如下:
|
1
2
3
4
5
6
7
|
self.piechartview = [[piechartview alloc] init];
self.piechartview.backgroundcolor = bgcolor;
[self.view addsubview:self.piechartview];
[self.piechartview mas_makeconstraints:^(masconstraintmaker *make) {
make.size.mas_equalto(cgsizemake(300, 300));
make.center.mas_equalto(self.view);
}];
|
二、设置饼状图外观样式
1. 基本样式
|
1
2
3
4
|
[self.piechartview setextraoffsetswithleft:30 top:0 right:30 bottom:0];//饼状图距离边缘的间隙
self.piechartview.usepercentvaluesenabled = yes;//是否根据所提供的数据, 将显示数据转换为百分比格式
self.piechartview.dragdecelerationenabled = yes;//拖拽饼状图后是否有惯性效果
self.piechartview.drawslicetextenabled = yes;//是否显示区块文本
|
2. 设置饼状图中间的空心样式
空心有两个圆组成, 一个是hole, 一个是transparentcircle, transparentcircle里面是hole, 所以饼状图中间的空心也就是一个同心圆. 代码如下:
|
1
2
3
4
5
|
self.piechartview.drawholeenabled = yes;//饼状图是否是空心
self.piechartview.holeradiuspercent = 0.5;//空心半径占比
self.piechartview.holecolor = [uicolor clearcolor];//空心颜色
self.piechartview.transparentcircleradiuspercent = 0.52;//半透明空心半径占比
self.piechartview.transparentcirclecolor = [uicolor colorwithred:210/255.0 green:145/255.0 blue:165/255.0 alpha:0.3];//半透明空心的颜色
|
3. 设置饼状图中心的文本
当饼状图是空心样式时, 可以在饼状图中心添加文本, 添加文本有两种方法. 一种方法是使用centertext 属性添加, 这种方法不能设置字体颜色、大小等. 另一种方法是使用centerattributedtext属性添加, 这种方法添加的富文本, 因此就可以对字体进行进一步美化了. 代码如下:
|
1
2
3
4
5
6
7
8
9
10
11
|
if (self.piechartview.isdrawholeenabled == yes) {
self.piechartview.drawcentertextenabled = yes;//是否显示中间文字
//普通文本
// self.piechartview.centertext = @"饼状图";//中间文字
//富文本
nsmutableattributedstring *centertext = [[nsmutableattributedstring alloc] initwithstring:@"饼状图"];
[centertext setattributes:@{nsfontattributename: [uifont boldsystemfontofsize:16],
nsforegroundcolorattributename: [uicolor orangecolor]}
range:nsmakerange(0, centertext.length)];
self.piechartview.centerattributedtext = centertext;
}
|
4. 设置饼状图描述
|
1
2
3
|
self.piechartview.descriptiontext = @"饼状图示例";
self.piechartview.descriptionfont = [uifont systemfontofsize:10];
self.piechartview.descriptiontextcolor = [uicolor graycolor];
|
6. 设置饼状图图例样式
|
1
2
3
4
5
6
7
|
self.piechartview.legend.maxsizepercent = 1;//图例在饼状图中的大小占比, 这会影响图例的宽高
self.piechartview.legend.formtotextspace = 5;//文本间隔
self.piechartview.legend.font = [uifont systemfontofsize:10];//字体大小
self.piechartview.legend.textcolor = [uicolor graycolor];//字体颜色
self.piechartview.legend.position = chartlegendpositionbelowchartcenter;//图例在饼状图中的位置
self.piechartview.legend.form = chartlegendformcircle;//图示样式: 方形、线条、圆形
self.piechartview.legend.formsize = 12;//图示大小
|
三、为饼状图提供数据
为饼状图提供数据, 首先需要创建两个数组yvals和xvals, yvals数组存放饼状图每个区块的数据, xvals存放的是每个区块的名称或者描述.
接着需要用piechartdataset.h类创建dataset对象, 创建时将yvals放进去.
然后需要用piechartdata.h类创建data对象, 创建时将xvals和dataset对象放进去.
最后直接把data对象赋值给饼状图的data属性即可. 创建data对象代码如下:
|
1
2
3
4
5
6
7
8
9
10
11
12
13
14
15
16
17
18
19
20
21
22
23
24
25
26
27
28
29
30
31
32
33
34
35
36
37
38
39
40
41
42
43
44
45
46
47
48
|
- (piechartdata *)setdata{
double mult = 100;
int count = 5;//饼状图总共有几块组成
//每个区块的数据
nsmutablearray *yvals = [[nsmutablearray alloc] init];
for (int i = 0; i < count; i++) {
double randomval = arc4random_uniform(mult + 1);
barchartdataentry *entry = [[barchartdataentry alloc] initwithvalue:randomval xindex:i];
[yvals addobject:entry];
}
//每个区块的名称或描述
nsmutablearray *xvals = [[nsmutablearray alloc] init];
for (int i = 0; i < count; i++) {
nsstring *title = [nsstring stringwithformat:@"part%d", i+1];
[xvals addobject:title];
}
//dataset
piechartdataset *dataset = [[piechartdataset alloc] initwithyvals:yvals label:@""];
dataset.drawvaluesenabled = yes;//是否绘制显示数据
nsmutablearray *colors = [[nsmutablearray alloc] init];
[colors addobjectsfromarray:chartcolortemplates.vordiplom];
[colors addobjectsfromarray:chartcolortemplates.joyful];
[colors addobjectsfromarray:chartcolortemplates.colorful];
[colors addobjectsfromarray:chartcolortemplates.liberty];
[colors addobjectsfromarray:chartcolortemplates.pastel];
[colors addobject:[uicolor colorwithred:51/255.f green:181/255.f blue:229/255.f alpha:1.f]];
dataset.colors = colors;//区块颜色
dataset.slicespace = 0;//相邻区块之间的间距
dataset.selectionshift = 8;//选中区块时, 放大的半径
dataset.xvalueposition = piechartvaluepositioninsideslice;//名称位置
dataset.yvalueposition = piechartvaluepositionoutsideslice;//数据位置
//数据与区块之间的用于指示的折线样式
dataset.valuelinepart1offsetpercentage = 0.85;//折线中第一段起始位置相对于区块的偏移量, 数值越大, 折线距离区块越远
dataset.valuelinepart1length = 0.5;//折线中第一段长度占比
dataset.valuelinepart2length = 0.4;//折线中第二段长度最大占比
dataset.valuelinewidth = 1;//折线的粗细
dataset.valuelinecolor = [uicolor browncolor];//折线颜色
//data
piechartdata *data = [[piechartdata alloc] initwithxvals:xvals dataset:dataset];
nsnumberformatter *formatter = [[nsnumberformatter alloc] init];
formatter.numberstyle = nsnumberformatterpercentstyle;
formatter.maximumfractiondigits = 0;//小数位数
formatter.multiplier = @1.f;
[data setvalueformatter:formatter];//设置显示数据格式
[data setvaluetextcolor:[uicolor browncolor]];
[data setvaluefont:[uifont systemfontofsize:10]];
return data;
}
|
运行结果如下:
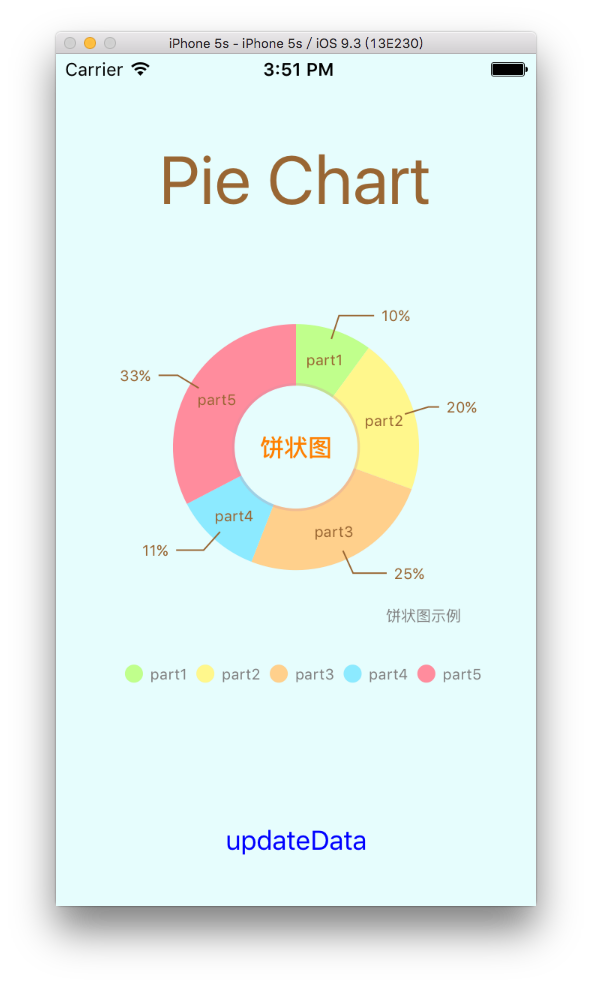
运行结果
如果不需要空心样式的饼状图, 可以将饼状图的drawholeenabled赋值为no, 将中间的文本去掉即可, 代码如下:
self.piechartview.drawholeenabled = no;
效果如下:
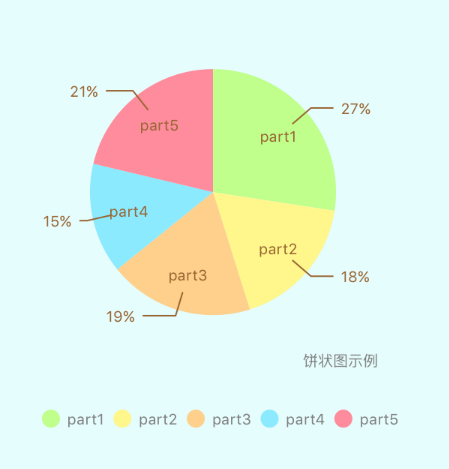
实心饼状图
每个区块之间如果需要间距, 可以通过dataset对象的slicespace属性设置, 代码如下:
dataset.slicespace = 3;
效果如下:
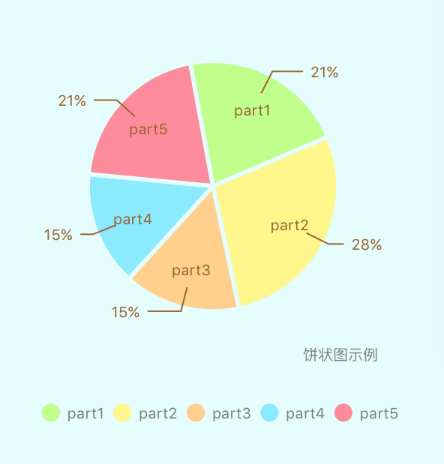
有区块间距的饼状图
由于属性较多, 其它效果可以自行尝试.
demo 下载地址: piechartdemo-master.rar
以上就是本文的全部内容,希望本文的内容对大家的学习或者工作能带来一定的帮助,同时也希望多多支持快网idc!

相关文章


- ASP.NET自助建站系统中的用户注册和登录功能定制方法 2025-06-10
- ASP.NET自助建站系统的域名绑定与解析教程 2025-06-10
- 个人服务器网站搭建:如何选择合适的服务器提供商? 2025-06-10
- ASP.NET自助建站系统中如何实现多语言支持? 2025-06-10
- 64M VPS建站:如何选择最适合的网站建设平台? 2025-06-10