

时间:2020年8月15日10:25:47
xdebug插件安装省略,自己百度安装,win和linux环境安装方式不一样。
注意和php版本匹配
1、phpinfo信息

2、php.ini配置
- [xdebug]
- zend_extension=/usr/lib64/php/modules/xdebug.so
- xdebug.remote_enable=1
- xdebug.profiler_enable=On
- xdebug.auto_trace=On
- xdebug.profiler_enable_trigger=On
- xdebug.profiler_output_name=cachegrind.out.%t.%p
- xdebug.remote_handler="dbgp"
- xdebug.remote_host="172.16.6.44"
- xdebug.remote_mode="req"
- xdebug.remote_port=9000
- xdebug.idekey="PHPSTORM"
- xdebug.remote_autostart=1
- ;xdebug.remote_connect_back=1
- ;Ifopenssl.cafileisnotspecifiedoriftheCAfileisnotfound,the
- ;directorypointedtobyopenssl.capathissearchedforasuitable
- ;certificate.Thisvaluemustbeacorrectlyhashedcertificatedirectory.
- ;MostusersshouldnotspecifyavalueforthisdirectiveasPHPwill
- ;attempttousetheOS-managedcertstoresinitsabsence.Ifspecified,
- ;thisvaluemaystillbeoverriddenonaper-streambasisviathe"capath"
- ;SSLstreamcontextoption.
- ;openssl.capath=
- ;LocalVariables:
- ;tab-width:4
- ;End:
- xdebug.var_display_max_children=10240
- xdebug.var_display_max_data=10240
- xdebug.var_display_max_depth=10240
3、当然你的xdebug.so扩展也要安装起来。

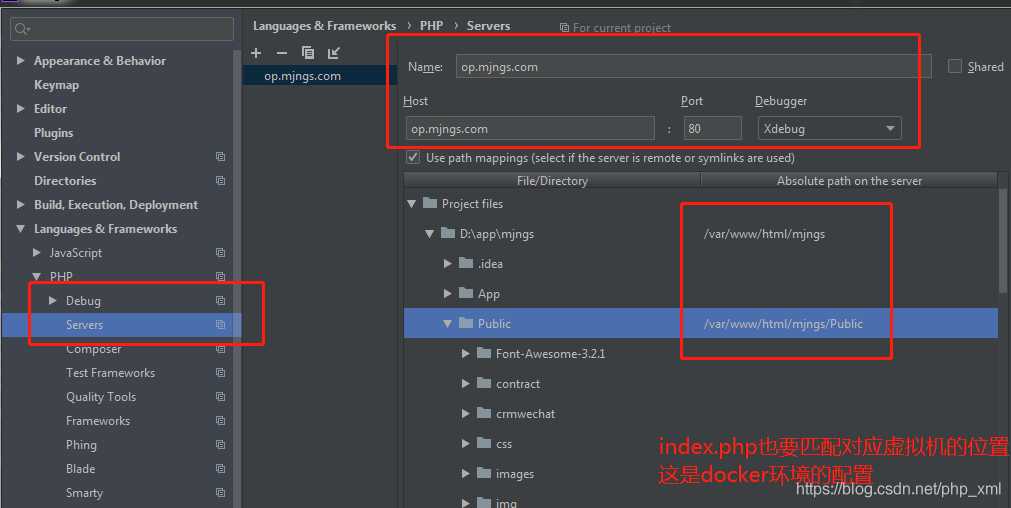
4、编辑器phpstorm配置

setting配置
端口和ini中配置的一样

本机ip配置,虚拟机的ip是192.168.99.26


输出窗口信息

代码界面输出


->这里的debug port要和php.ini里面的 xdebug.remote_port相一致!默认是9000,如果9000端口被占用的话,可以改成其他 端口。
4.开始使用断点调试
-〉开启调试(phpstrom)
1、设置断点

f9跳出
f8下一步
->浏览器增加开启和关闭按钮
https://www.jetbrains.com/phpstorm/marklets/

-〉在代码中打断点,运行访问该页面的url
浏览器开启调试,然后刷新页面即可。
总结
到此这篇关于php开发最强大的ide编辑的phpstorm 2020.2配置xdebug调试的文章就介绍到这了,更多相关phpstorm调试配置 xdebug内容请搜索快网idc以前的文章或继续浏览下面的相关文章希望大家以后多多支持快网idc!
原文链接:https://blog.csdn.net/php_xml/article/details/108018926


相关文章


猜你喜欢
- ASP.NET自助建站系统中如何实现多语言支持? 2025-06-10
- 64M VPS建站:如何选择最适合的网站建设平台? 2025-06-10
- ASP.NET本地开发时常见的配置错误及解决方法? 2025-06-10
- ASP.NET自助建站系统的数据库备份与恢复操作指南 2025-06-10
- 个人网站服务器域名解析设置指南:从购买到绑定全流程 2025-06-10