

效果图
先上图(做出来的效果就是下图的样子)
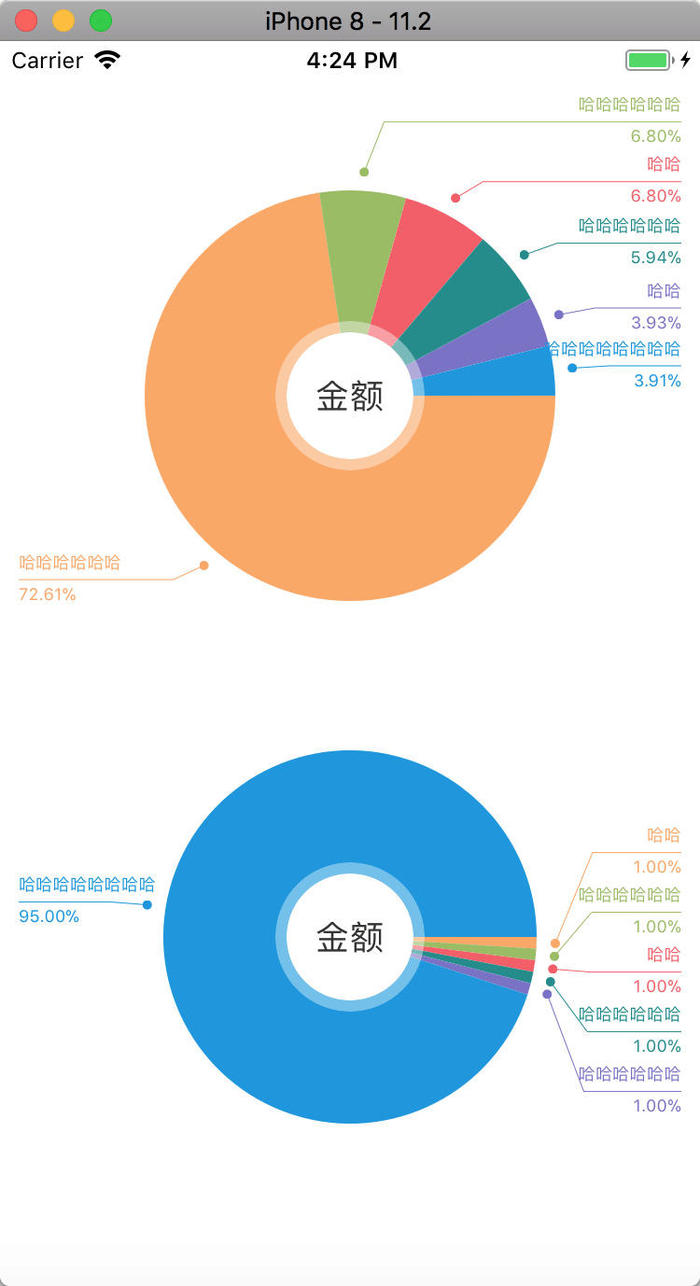
1.效果图-w220
图中不论每个扇形多小,都可以从指引线处将指引的数据分割开来,不会重叠。
第一步
需要给图中数据做个模型
|
1
2
3
4
5
6
7
8
9
10
11
12
13
14
15
16
|
@interface dvfoodpiemodel : nsobject
/**
名称
*/
@property (copy, nonatomic) nsstring *name;
/**
数值
*/
@property (assign, nonatomic) cgfloat value;
/**
比例
*/
@property (assign, nonatomic) cgfloat rate;
@end
|
第二步
现在先把饼图中间的圆形做出来,这个没有什么难度,直接贴代码
在.h文件中
|
1
2
3
|
@interface dvpiecenterview : uiview
@property (strong, nonatomic) uilabel *namelabel;
@end
|
在.m文件中
|
1
2
3
4
5
6
7
8
9
10
11
12
13
14
15
16
17
18
19
20
21
22
23
24
25
26
27
28
29
30
31
|
@interface dvpiecenterview ()
@property (strong, nonatomic) uiview *centerview;
@end
@implementation dvpiecenterview
- (instancetype)initwithframe:(cgrect)frame {
if (self = [super initwithframe:frame]) {
self.backgroundcolor = [[uicolor whitecolor] colorwithalphacomponent:0.4];
uiview *centerview = [[uiview alloc] init];
centerview.backgroundcolor = [uicolor whitecolor];
[self addsubview:centerview];
self.centerview = centerview;
uilabel *namelabel = [[uilabel alloc] init];
namelabel.textcolor = [uicolor colorwithred:51/255.0 green:51/255.0 blue:51/255.0 alpha:1];
namelabel.font = [uifont systemfontofsize:18];
namelabel.textalignment = nstextalignmentcenter;
self.namelabel = namelabel;
[centerview addsubview:namelabel];
}
return self;
}
- (void)layoutsubviews {
[super layoutsubviews];
self.layer.cornerradius = self.frame.size.width * 0.5;
self.layer.maskstobounds = true;
self.centerview.frame = cgrectmake(6, 6, self.frame.size.width - 6 * 2, self.frame.size.height - 6 * 2);
self.centerview.layer.cornerradius = self.centerview.frame.size.width * 0.5;
self.centerview.layer.maskstobounds = true;
self.namelabel.frame = self.centerview.bounds;
}
|
暴露的只有.h文件中的namelabel,需要中间显示文字时,给namelabel的text赋值就好了
第三步
现在就创建一个继承uiview的视图,用来画饼状图和指引线以及数据
在.h文件中需要有数据数组,还有中间显示的文字,以及一个draw方法(draw方法纯属个人习惯,在数据全部赋值完成后,调用该方法进行绘画)
|
1
2
3
4
5
6
7
8
9
10
11
12
13
14
|
@interface dvpiechart : uiview
/**
数据数组
*/
@property (strong, nonatomic) nsarray *dataarray;
/**
标题
*/
@property (copy, nonatomic) nsstring *title;
/**
绘制方法
*/
- (void)draw;
@end
|
在调用draw方法前应确定数据全部赋值完成,绘制工作其实是在- (void)drawrect:(cgrect)rect方法中完成的,所以.h文件中的draw方法只是来调用系统方法的
在.m文件中,draw方法的实现
|
1
2
3
4
|
- (void)draw {
[self.subviews makeobjectsperformselector:@selector(removefromsuperview)];
[self setneedsdisplay];
}
|
[self setneedsdisplay];就是来调用drawrect方法的
[self.subviews makeobjectsperformselector:@selector(removefromsuperview)];这个方法是用来移除添加到piechart上的centerview,不然每次重绘时都会再次添加一个centerview
下面就是drawrect方法的实现
首先需要确定圆的半径,中心点和起始点
|
1
2
3
4
5
6
|
cgfloat min = self.bounds.size.width > self.bounds.size.height ? self.bounds.size.height : self.bounds.size.width;
cgpoint center = cgpointmake(self.bounds.size.width * 0.5, self.bounds.size.height * 0.5);
cgfloat radius = min * 0.5 - chart_margin;
cgfloat start = 0;
cgfloat angle = 0;
cgfloat end = start;
|
chart_margin是自己定义的一个宏,圆不能让视图的边形成切线,在此我把chart_margin设定为60
* 根据产品的需求,当请求回来的数据为空时,显示一个纯色的圆,不画指引线,所以在drawrect中分两种情况来实现
|
1
2
3
4
5
6
7
8
9
10
11
12
13
14
15
16
17
18
19
20
21
22
23
24
25
26
27
28
29
30
|
```objc
if (self.dataarray.count == 0) {
} else {
}
```
* 当dataarray的长度为0时
```objc
if (self.dataarray.count == 0) {
end = start + m_pi * 2;
uicolor *color = color_array.firstobject;
uibezierpath *path = [uibezierpath bezierpathwitharccenter:center radius:radius startangle:start endangle:end clockwise:true];
[color set];
//添加一根线到圆心
[path addlinetopoint:center];
[path fill];
}
```
> color_array是自己设定的一个宏定义,产品要求的饼图份数是6份,每份颜色一定,所以做一个宏定义存储一下(做成变量都是可以的,看自己代码风格)
``` objc
#define color_array @[\\
|
[uicolor colorwithred:251/255.0 green:166.9/255.0 blue:96.5/255.0 alpha:1],
[uicolor colorwithred:151.9/255.0 green:188/255.0 blue:95.8/255.0 alpha:1],
[uicolor colorwithred:245/255.0 green:94/255.0 blue:102/255.0 alpha:1],
[uicolor colorwithred:29/255.0 green:140/255.0 blue:140/255.0 alpha:1],
[uicolor colorwithred:121/255.0 green:113/255.0 blue:199/255.0 alpha:1],
[uicolor colorwithred:16/255.0 green:149/255.0 blue:224/255.0 alpha:1]
]
“`
* 当dataarray的长度不为0时
|
1
2
3
4
5
6
7
8
9
10
11
12
13
14
15
16
|
```objc
for (int i = 0; i < self.dataarray.count; i++) {
dvfoodpiemodel *model = self.dataarray[i];
cgfloat percent = model.rate;
uicolor *color = color_array[i % 6];
start = end;
angle = percent * m_pi * 2;
end = start + angle;
uibezierpath *path = [uibezierpath bezierpathwitharccenter:center radius:radius startangle:start endangle:end clockwise:true];
[color set];
//添加一根线到圆心
[path addlinetopoint:center];
[path fill];
}
```
|
在else中这么做,就能绘制出各个扇形
|
1
2
3
4
5
6
7
8
9
10
11
|
* 在扇形绘画出来后,添加centerview
```objc
// 在中心添加label
dvpiecenterview *centerview = [[dvpiecenterview alloc] init];
centerview.frame = cgrectmake(0, 0, 80, 80);
cgrect frame = centerview.frame;
frame.origin = cgpointmake(self.frame.size.width * 0.5 - frame.size.width * 0.5, self.frame.size.height * 0.5 - frame.size.width * 0.5);
centerview.frame = frame;
centerview.namelabel.text = self.title;
[self addsubview:centerview];
```
|
第四步,绘画指引线和数据
绘制指引线,需要在画扇形时就确定几个数据,并根据这几种数据进行绘制
- 各个扇形圆弧的中心点
- 指引线的重点(效果图中有圆点的位置)
|
1
2
3
4
5
6
|
// 获取弧度的中心角度
cgfloat radiancenter = (start + end) * 0.5;
// 获取指引线的终点
cgfloat linestartx = self.frame.size.width * 0.5 + radius * cos(radiancenter);
cgfloat linestarty = self.frame.size.height * 0.5 + radius * sin(radiancenter);
cgpoint point = cgpointmake(linestartx, linestarty);
|
因为这个图刚刚做出来时是有重叠的,按产品需求进行更改,所以起的变量名称会有些歧义,不方便改了,我只能做好注释,大家以注释为准
如果按顺序进行绘制的话,那么很难让指引线的位置不重叠,所以从中间的一个数据先进行绘制,然后在绘制中间数据两侧的数据
那么,现在需要将上面需要确定的数据依次添加到一个数组中
例:原数据为@[@1, @2, @3, @4, @5, @6]
画指引线时则需要数据这样来弄@[@3, @2, @1, @4, @5, @6]
所以for循环中应该改成这个样子
注意,数据变更顺序了之后,绘制时模型数据和颜色数据也需要变更顺序
首先声明两个变量
|
1
2
3
4
|
@interface dvpiechart ()
@property (nonatomic, strong) nsmutablearray *modelarray;
@property (nonatomic, strong) nsmutablearray *colorarray;
@end
|
else中变成下面这个样子
|
1
2
3
4
5
6
7
8
9
10
11
12
13
14
15
16
17
18
19
20
21
22
23
24
25
26
27
28
29
30
31
32
33
34
|
nsmutablearray *pointarray = [nsmutablearray array];
nsmutablearray *centerarray = [nsmutablearray array];
self.modelarray = [nsmutablearray array];
self.colorarray = [nsmutablearray array];
for (int i = 0; i < self.dataarray.count; i++) {
dvfoodpiemodel *model = self.dataarray[i];
cgfloat percent = model.rate;
uicolor *color = color_array[i];
start = end;
angle = percent * m_pi * 2;
end = start + angle;
uibezierpath *path = [uibezierpath bezierpathwitharccenter:center radius:radius startangle:start endangle:end clockwise:true];
[color set];
//添加一根线到圆心
[path addlinetopoint:center];
[path fill];
// 获取弧度的中心角度
cgfloat radiancenter = (start + end) * 0.5;
// 获取指引线的终点
cgfloat linestartx = self.frame.size.width * 0.5 + radius * cos(radiancenter);
cgfloat linestarty = self.frame.size.height * 0.5 + radius * sin(radiancenter);
cgpoint point = cgpointmake(linestartx, linestarty);
if (i <= self.dataarray.count / 2 - 1) {
[pointarray insertobject:[nsvalue valuewithcgpoint:point] atindex:0];
[centerarray insertobject:[nsnumber numberwithfloat:radiancenter] atindex:0];
[self.modelarray insertobject:model atindex:0];
[self.colorarray insertobject:color atindex:0];
} else {
[pointarray addobject:[nsvalue valuewithcgpoint:point]];
[centerarray addobject:[nsnumber numberwithfloat:radiancenter]];
[self.modelarray addobject:model];
[self.colorarray addobject:color];
}
}
|
for循环中确定了需要的数据:
pointarray、centerarray、self.modelarray、self.colorarray
根据上面确定的数据来绘出指引线,逻辑比较复杂,写一个方法来绘制
|
1
|
- (void)drawlinewithpointarray:(nsarray *)pointarray centerarray:(nsarray *)centerarray
|
在for循环外调用
|
1
2
|
// 通过pointarray和centerarray绘制指引线
[self drawlinewithpointarray:pointarray centerarray:centerarray];
|
第五步
方法内部实现
需要确定的数据都有:
1.指引线长度
2.指引线起点、终点、转折点
3.指引线数据所占的rect范围(用于确定绘制下一个的时候是否有重叠)
下面直接贴出代码实现,注意看注释,我就不在代码外再写一遍了
|
1
2
3
4
5
6
7
8
9
10
11
12
13
14
15
16
17
18
19
20
21
22
23
24
25
26
27
28
29
30
31
32
33
34
35
36
37
38
39
40
41
42
43
44
45
46
47
48
49
50
51
52
53
54
55
56
57
58
59
60
61
62
63
64
65
66
67
68
69
70
71
72
73
74
75
76
77
78
79
80
81
82
83
84
85
86
87
88
89
90
91
92
93
94
95
96
97
98
99
100
101
102
103
104
105
106
107
108
109
110
111
112
113
114
115
116
117
118
119
120
121
122
123
124
125
126
127
128
129
130
131
132
133
134
135
136
137
138
139
140
141
142
143
144
145
146
147
148
149
150
151
152
153
154
155
156
157
158
159
160
161
162
163
164
165
166
167
168
169
170
171
172
173
174
175
176
177
178
179
180
181
|