

一:介绍
在项目中遇到数据展示需求时,往往会通过,以列表的形式展示出数据或者以表格的形式展示。但是并不能直观的观察数据的变化,如果通过图表的形式来展示,就可以更快捷的获取到数据变化情况。
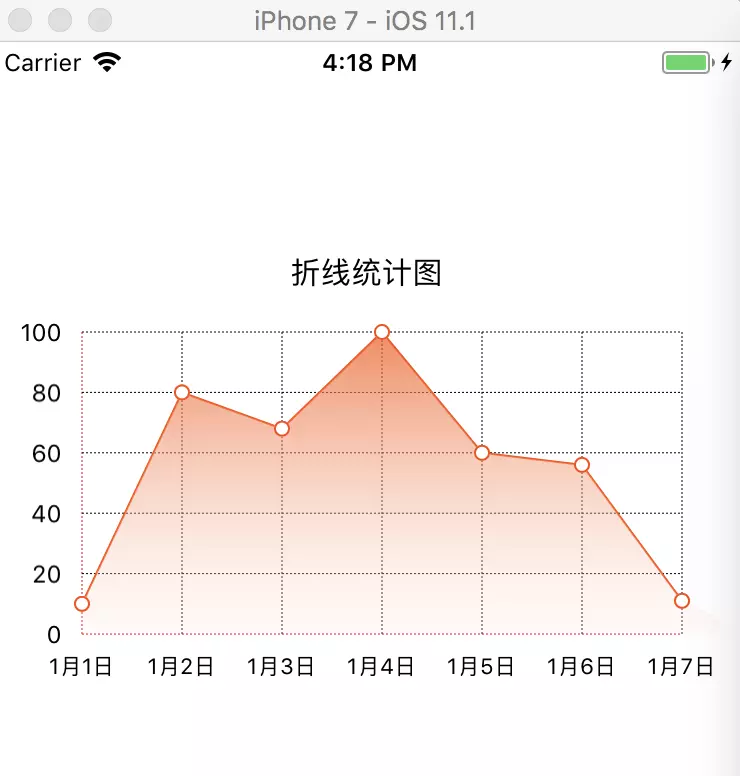
图表展示的方式大致分为折线图、柱状图、饼状图等等,那么如何码出一个高颜值原生折线图呢?demo源码已经放在github上,下面来介绍一下如何使用。
二:项目展示
运行后的展示截图如下:
三: 实现思路分析
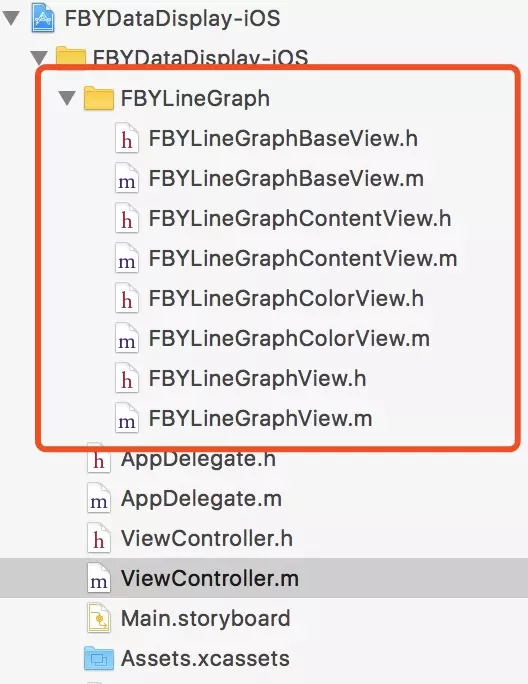
实现折线图的核心代码是下面四个类:
- fbylinegraphbaseview
- fbylinegraphcontentview
- fbylinegraphcolorview
- fbylinegraphview
下面针对这四个类实现做一个详细的流程分析。
1. 折线图基础框架实现(fbylinegraphbaseview类)
折线图基础框架包括y轴刻度标签、x轴刻度标签、与x轴平行的网格线的间距、网格线的起始点、x 轴长度、y 轴长度,代码如下:
|
1
2
3
4
5
6
7
8
9
10
11
12
13
14
15
16
17
18
19
|
#import <uikit uikit.h="">
@interface fbylinegraphbaseview : uiview
//y轴刻度标签
@property (nonatomic, strong) nsarray *ymarktitles;
//x轴刻度标签
@property (nonatomic, strong) nsarray *xmarktitles;
// 与x轴平行的网格线的间距
@property (nonatomic, assign) cgfloat xscalemarklen;
//网格线的起始点
@property (nonatomic, assign) cgpoint startpoint;
//x 轴长度
@property (nonatomic, assign) cgfloat yaxis_l;
//y 轴长度
@property (nonatomic, assign) cgfloat xaxis_l;
//绘图
- (void)mapping;
//更新做标注数据
- (void)reloaddatas;
@end</uikit>
|
2. 折线图数据内容显示(fbylinegraphcontentview类)
折线图数据内容显示是继承fbylinegraphbaseview类进行实现,其中主要包括,x轴最大值、数据内容来实现,代码如下:
|
1
2
3
4
5
6
7
8
9
10
|
#import <uikit uikit.h="">
#import "fbylinegraphbaseview.h"
@interface fbylinegraphcontentview : fbylinegraphbaseview
@property (nonatomic, strong) nsarray *valuearray;
@property (nonatomic, assign) cgfloat maxvalue;
//绘图
- (void)mapping;
//更新折线图数据
- (void)reloaddatas;
@end</uikit>
|
3. 折线图颜色控制类(fbylinegraphcolorview类)
折线图颜色控制类主要控制选中远点边框宽度和整体布局颜色,代码如下:
|
1
2
3
4
5
6
7
|
#import <uikit uikit.h="">
@interface fbylinegraphcolorview : uiview
//颜色设置
@property (nonatomic, assign) cgfloat borderwidth;
@property (nonatomic, assign) uicolor *bordercolor;
- (instancetype)initwithcenter:(cgpoint)center radius:(cgfloat)radius;
@end</uikit>
|
4. 折线图核心代码类(fbylinegraphview类)
折线图核心代码类主要给引用类提供配置接口和数据接口,其中包括表名、y轴刻度标签title、y轴最大值、x轴刻度标签的长度(单位长度)、设置折线图显示的数据和对应x坐标轴刻度标签,代码如下:
|
1
2
3
4
5
6
7
8
9
10
11
12
13
14
15
16
17
18
19
20
21
|
#import <uikit uikit.h="">
@interface fbylinegraphview : uiview
//表名
@property (nonatomic, strong) nsstring *title;
//y轴刻度标签title
@property (nonatomic, strong) nsarray *ymarktitles;
//y轴最大值
@property (nonatomic, assign) cgfloat maxvalue;
//x轴刻度标签的长度(单位长度)
@property (nonatomic, assign) cgfloat xscalemarklen;
/**
* 设置折线图显示的数据和对应x坐标轴刻度标签
*
* @param xmarktitlesandvalues 折线图显示的数据和x坐标轴刻度标签
* @param titlekey 标签(如:9月1日)
* @param valuekey 数据 (如:80)
*/
- (void)setxmarktitlesandvalues:(nsarray *)xmarktitlesandvalues titlekey:(nsstring *)titlekey valuekey:(nsstring *)valuekey;
- (void)mapping;
- (void)reloaddatas;
@end</uikit>
|
四:如何在项目中使用
1. 下载源码
github 源码链接
在demo中找到fbylinegraph文件夹,将文件夹拖入自己的项目中。
2. 代码引用
2.1 首先在项目中需要使用的页面引用
|
1
|
#import "fbylinegraphview.h"
|
2.2 初始化折线图
|
1
|
fbylinegraphview *linegraphview = [[fbylinegraphview alloc] initwithframe:cgrectmake(10, 100, screen_width - 20, 220)];
|
2.3 设置折线图属性
|
1
2
3
|
linegraphview.title = @"折线统计图"; // 折线图名称
linegraphview.maxvalue = 100; // 最大值
linegraphview.xscalemarklen = 60; // 每格的宽度如果不设置,系统默认平均分配
|
2.4 给折线图添加内容
|
1
2
|
linegraphview.ymarktitles = @[@"0",@"20",@"40",@"60",@"80",@"100"]; // y轴刻度标签
[linegraphview setxmarktitlesandvalues:@[@{@"item":@"1月1日",@"count":@10},@{@"item":@"1月2日",@"count":@80},@{@"item":@"1月3日",@"count":@68},@{@"item":@"1月4日",@"count":@100},@{@"item":@"1月5日",@"count":@60},@{@"item":@"1月6日",@"count":@56},@{@"item":@"1月7日",@"count":@11}] titlekey:@"item" valuekey:@"count"]; // x轴刻度标签及相应的值
|
可以根据自己项目获取的数据进行修改,不过数据格式不要改动。
2.5 设置完数据和属性,绘制展示折线图
|
1
2
3
|
//设置完数据等属性后绘图折线图
[linegraphview mapping];
[self.view addsubview:linegraphview];
|
设置完上面的,一个高颜值原生折线统计图就可以使用了。
如果好用就请点赞关注,会不定期更新更多干货。更多源码可以去github下载。

相关文章


- ASP.NET自助建站系统的数据库备份与恢复操作指南 2025-06-10
- 个人网站服务器域名解析设置指南:从购买到绑定全流程 2025-06-10
- 个人网站搭建:如何挑选具有弹性扩展能力的服务器? 2025-06-10
- 个人服务器网站搭建:如何选择适合自己的建站程序或框架? 2025-06-10
- 64M VPS建站:能否支持高流量网站运行? 2025-06-10