


什么是SLI/SLO
SLI,全名Service Level Indicator,是服务等级指标的简称,它是衡定系统稳定性的指标。
SLO,全名Sevice Level Objective,是服务等级目标的简称,也就是我们设定的稳定性目标,比如"4个9","5个9"等。
SRE通常通过这两个指标来衡量系统的稳定性,其主要思路就是通过SLI来判断SLO,也就是通过一系列的指标来衡量我们的目标是否达到了"几个9"。
如何选择SLI
在系统中,常见的指标有很多种,比如:
- 系统层面:CPU使用率、内存使用率、磁盘使用率等
- 应用服务器层面:端口存活状态、JVM的状态等
- 应用运行层面:状态码、时延、QPS等
- 中间件层面:QPS、TPS、时延等
- 业务层面:成功率、增长速度等
这么多指标,应该如何选择呢?只要遵从两个原则就可以:
- 选择能够标识一个主体是否稳定的指标,如果不是这个主体本身的指标,或者不能标识主体稳定性的,就要排除在外。
- 优先选择与用户体验强相关或用户可以明显感知的指标。
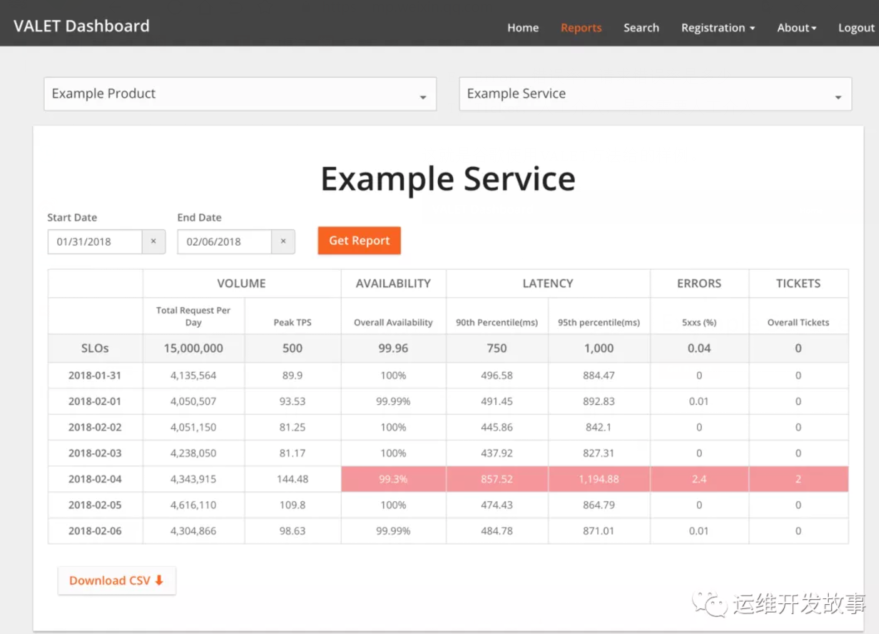
通常情况下,可以直接使用谷歌的VALET指标方法。
- V:Volume,容量,服务承诺的最大容量
- A:Availability,可用性,服务是否正常
- L:Latency,延迟,服务的响应时间
- E:Error,错误率,请求错误率是多少
- T:Ticket,人工介入,是否需要人工介入
这就是谷歌使用VALET方法给的样例。
上面仅仅是简单的介绍了一下SLI/SLO,更多的知识可以学习《SRE:Google运维解密》和赵成老师的极客时间课程《SRE实践手册》。下面来简单介绍如何使用Prometheus来进行SLI/SLO监控。
service-level-operator
Service level operator是为了Kubernetes中的应用SLI/SLO指标来衡量应用的服务指标,并可以通过Grafana来进行展示。
Operator主要是通过SLO来查看和创建新的指标。例如:
- apiVersion:monitoring.spotahome.com/v1alpha1
- kind:ServiceLevel
- metadata:
- name:awesome-service
- spec:
- serviceLevelObjectives:
- –name:"9999_http_request_lt_500"
- description:99.99%ofrequestsmustbeservedwith<500statuscode.
- disable:false
- availabilityObjectivePercent:99.99
- serviceLevelIndicator:
- prometheus:
- address:http://myprometheus:9090
- totalQuery:sum(increase(http_request_total{host="awesome_service_io"}[2m]))
- errorQuery:sum(increase(http_request_total{host="awesome_service_io",code=~"5.."}[2m]))
- output:
- prometheus:
- labels:
- team:a-team
- iteration:"3"
- availabilityObjectivePercent:SLO
- totalQuery:总请求数
- errorQuery:错误请求数
Operator通过totalQuert和errorQuery就可以计算出SLO的指标了。
部署service-level-operator
- 前提:在Kubernetes集群中部署好Prometheus,我这里是采用Prometheus-Operator方式进行部署的。
(1)首先创建RBAC
- apiVersion:v1
- kind:ServiceAccount
- metadata:
- name:service-level-operator
- namespace:monitoring
- labels:
- app:service-level-operator
- component:app
- —
- apiVersion:rbac.authorization.k8s.io/v1
- kind:ClusterRole
- metadata:
- name:service-level-operator
- labels:
- app:service-level-operator
- component:app
- rules:
- #RegisterandcheckCRDs.
- -apiGroups:
- -apiextensions.k8s.io
- resources:
- -customresourcedefinitions
- verbs:
- –"*"
- #Operatorlogic.
- -apiGroups:
- -monitoring.spotahome.com
- resources:
- -servicelevels
- -servicelevels/status
- verbs:
- –"*"
- —
- kind:ClusterRoleBinding
- apiVersion:rbac.authorization.k8s.io/v1
- metadata:
- name:service-level-operator
- subjects:
- -kind:ServiceAccount
- name:service-level-operator
- namespace:monitoring
- roleRef:
- apiGroup:rbac.authorization.k8s.io
- kind:ClusterRole
- name:service-level-operator
(2)然后创建Deployment
- apiVersion:apps/v1
- kind:Deployment
- metadata:
- name:service-level-operator
- namespace:monitoring
- labels:
- app:service-level-operator
- component:app
- spec:
- replicas:1
- selector:
- matchLabels:
- app:service-level-operator
- component:app
- strategy:
- rollingUpdate:
- maxUnavailable:0
- template:
- metadata:
- labels:
- app:service-level-operator
- component:app
- spec:
- serviceAccountName:service-level-operator
- containers:
- –name:app
- imagePullPolicy:Always
- image:quay.io/spotahome/service-level-operator:latest
- ports:
- -containerPort:8080
- name:http
- protocol:TCP
- readinessProbe:
- httpGet:
- path:/healthz/ready
- port:http
- livenessProbe:
- httpGet:
- path:/healthz/live
- port:http
- resources:
- limits:
- cpu:220m
- memory:254Mi
- requests:
- cpu:120m
- memory:128Mi
(3)创建service
- apiVersion:v1
- kind:Service
- metadata:
- name:service-level-operator
- namespace:monitoring
- labels:
- app:service-level-operator
- component:app
- spec:
- ports:
- -port:80
- protocol:TCP
- name:http
- targetPort:http
- selector:
- app:service-level-operator
- component:app
(4)创建prometheus serviceMonitor
- apiVersion:monitoring.coreos.com/v1
- kind:ServiceMonitor
- metadata:
- name:service-level-operator
- namespace:monitoring
- labels:
- app:service-level-operator
- component:app
- prometheus:myprometheus
- spec:
- selector:
- matchLabels:
- app:service-level-operator
- component:app
- namespaceSelector:
- matchNames:
- -monitoring
- endpoints:
- -port:http
- interval:10s
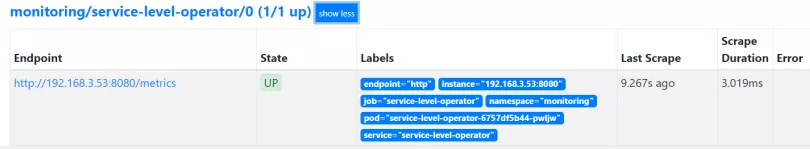
到这里,Service Level Operator部署完成了,可以在prometheus上查看到对应的Target,如下:
然后就需要创建对应的服务指标了,如下所示创建一个示例。
- apiVersion:monitoring.spotahome.com/v1alpha1
- kind:ServiceLevel
- metadata:
- name:prometheus-grafana-service
- namespace:monitoring
- spec:
- serviceLevelObjectives:
- –name:"9999_http_request_lt_500"
- description:99.99%ofrequestsmustbeservedwith<500statuscode.
- disable:false
- availabilityObjectivePercent:99.99
- serviceLevelIndicator:
- prometheus:
- address:http://prometheus-k8s.monitoring.svc:9090
- totalQuery:sum(increase(http_request_total{service="grafana"}[2m]))
- errorQuery:sum(increase(http_request_total{service="grafana",code=~"5.."}[2m]))
- output:
- prometheus:
- labels:
- team:prometheus-grafana
- iteration:"3"
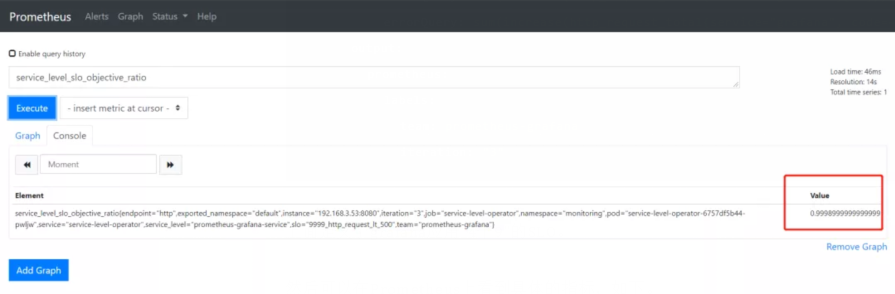
上面定义了grafana应用"4个9"的SLO。
然后可以在Prometheus上看到具体的指标,如下。
接下来在Grafana上导入ID为8793的Dashboard,即可生成如下图表。
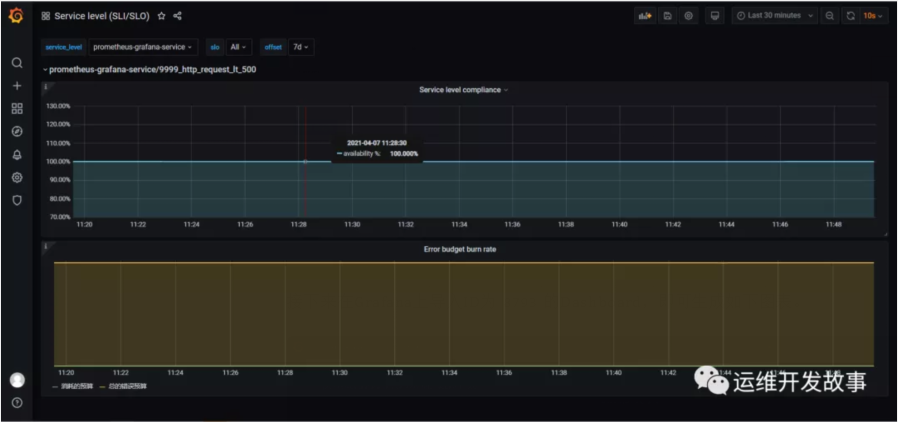
上面是SLI,下面是错误总预算和已消耗的错误。
下面可以定义告警规则,当SLO下降时可以第一时间收到,比如:
- groups:
- –name:slo.rules
- rules:
- -alert:SLOErrorRateTooFast1h
- expr:|
- (
- increase(service_level_sli_result_error_ratio_total[1h])
- /
- increase(service_level_sli_result_count_total[1h])
- )>(1-service_level_slo_objective_ratio)*14.6
- labels:
- severity:critical
- team:a-team
- annotations:
- summary:ThemonthlySLOerrorbudgetconsumedfor1hisgreaterthan2%
- description:Theerrorratefor1hinthe{{$labels.service_level}}/{{$labels.slo}}SLOerrorbudgetisbeingconsumedtoofast,isgreaterthan2%monthlybudget.
- -alert:SLOErrorRateTooFast6h
- expr:|
- (
- increase(service_level_sli_result_error_ratio_total[6h])
- /
- increase(service_level_sli_result_count_total[6h])
- )>(1-service_level_slo_objective_ratio)*6
- labels:
- severity:critical
- team:a-team
- annotations:
- summary:ThemonthlySLOerrorbudgetconsumedfor6hisgreaterthan5%
- description:Theerrorratefor6hinthe{{$labels.service_level}}/{{$labels.slo}}SLOerrorbudgetisbeingconsumedtoofast,isgreaterthan5%monthlybudget.
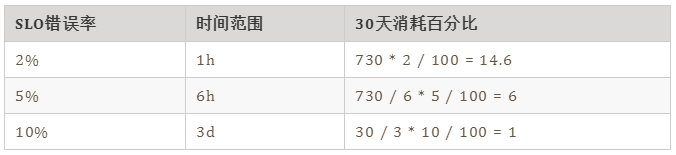
第一条规则表示在1h内消耗的错误率大于30天内的2%,应该告警。第二条规则是在6h内的错误率大于30天的5%,应该告警。
下面是谷歌的的基准。
最后
说到系统稳定性,这里不得不提到系统可用性,SRE提高系统的稳定性,最终还是为了提升系统的可用时间,减少故障时间。那如何来衡量系统的可用性呢?
目前业界有两种衡量系统可用性的方式,一个是时间维度,一个是请求维度。时间维度就是从故障出发对系统的稳定性进行评估。请求维度是从成功请求占比的角度出发,对系统稳定性进行评估。
时间维度:可用性 = 服务时间 / (服务时间 + 故障时间)
请求维度:可用性 = 成功请求数 / 总请求数
在SRE实践中,通常会选择请求维度来衡量系统的稳定性,就如上面的例子。不过,如果仅仅通过一个维度来判断系统的稳定性也有点太武断,还应该结合更多的指标,比如延迟,错误率等,而且对核心应用,核心链路的SLI应该更细致。
参考
[1] 《SRE实践手册》- 赵成
[2] 《SRE:Google运维解密》
[3] https://github.com/spotahome/service-level-operator
原文地址:https://mp.weixin.qq.com/s/KAQLFqlZsPR0wHDjO_ymig