
我们知道压力测试的软件确实很多,诸如微软的WAST,惠普的LoadRunner以及等等其他的,但这些软件学习起来还是需要花费些时间,在选择上实在头痛,后来在郭欣的那本《构建高性能WEB站点》上看到了他介绍的这款Apache自带的压力测试工具ab,十分喜爱,于是今天终于有机会体验下ab对网站的压力测试。 实验之前我的apache已经安装了,操作系统:Ubuntu 10.04 VMware 7.0
1、先查看一下版本信息 ab -V(注意是大写的V)
|
1
2
3
4 |
studiogang@studiogang:~$ ab -V
This is ApacheBench, Version 2.3 <$Revision: 655654 $>
Copyright 1996 Adam Twiss, Zeus Technology Ltd, http://www.zeustech.net/
Licensed to The Apache Software Foundation, http://www.apache.org/ |
2、我们也可以使用小写的v查看下ab命令的一些属性 ab -v
|
1
2
3
4
5
6
7
8
9
10
11
12
13
14
15
16
17
18
19
20
21
22
23
24
25
26
27
28
29
30
31
32
33
34
35
36
37
38 |
studiogang@studiogang:~$ ab -v
ab: option requires an argument -- v
ab: wrong number of arguments
Usage: ab [options] [http[s]://]hostname[:port]/path
Options are:
-n requests Number of requests to perform
-c concurrency Number of multiple requests to make
-t timelimit Seconds to max. wait for responses
-b windowsize Size of TCP send/receive buffer, in bytes
-p postfile File containing data to POST. Remember also to set -T
-u putfile File containing data to PUT. Remember also to set -T
-T content-type Content-type header for POSTing, eg.
'application/x-www-form-urlencoded'
Default is 'text/plain'
-v verbosity How much troubleshooting info to print
-w Print out results in HTML tables
-i Use HEAD instead of GET
-x attributes String to insert as table attributes
-y attributes String to insert as tr attributes
-z attributes String to insert as td or th attributes
-C attribute Add cookie, eg. 'Apache=1234. (repeatable)
-H attribute Add Arbitrary header line, eg. 'Accept-Encoding: gzip'
Inserted after all normal header lines. (repeatable)
-A attribute Add Basic WWW Authentication, the attributes
are a colon separated username and password.
-P attribute Add Basic Proxy Authentication, the attributes
are a colon separated username and password.
-X proxy:port Proxyserver and port number to use
-V Print version number and exit
-k Use HTTP KeepAlive feature
-d Do not show percentiles served table.
-S Do not show confidence estimators and warnings.
-g filename Output collected data to gnuplot format file.
-e filename Output CSV file with percentages served
-r Don't exit on socket receive errors.
-h Display usage information (this message)
-Z ciphersuite Specify SSL/TLS cipher suite (See openssl ciphers)
-f protocol Specify SSL/TLS protocol (SSL2, SSL3, TLS1, or ALL) |
3、现在我们就对51CTO的网站进行一次压力测试吧,使用命令ab-n1000-c10http://www.jb51.net/index.php,其中 -n1000 表示总请求数 -c10表示并发用户数为10http://www.jb51.net/index.php表示请求的URL,下面是测试的结果,其中我们最关心的三个指标,我已经注释出来了。
|
1
2
3
4
5
6
7
8
9
10
11
12
13
14
15
16
17
18
19
20
21
22
23
24
25
26
27
28
29
30
31
32
33
34
35
36
37
38
39
40
41
42
43
44
45
46
47
48
49
50
51
52
53
54
55
56
57
58
59
60
61
62 |
studiogang@studiogang:~$ ab -n1000 -c10 http://www.51cto.com/index.php
This is ApacheBench, Version 2.3 <$Revision: 655654 $>
Copyright 1996 Adam Twiss, Zeus Technology Ltd, http://www.zeustech.net/
Licensed to The Apache Software Foundation, http://www.apache.org/
Benchmarking www.51cto.com (be patient)
Completed 100 requests
Completed 200 requests
Completed 300 requests
Completed 400 requests
Completed 500 requests
Completed 600 requests
Completed 700 requests
Completed 800 requests
Completed 900 requests
Completed 1000 requests
Finished 1000 requests
/*WEB服务器用的是nginx*/
Server Software: nginx
Server Hostname: www.51cto.com
Server Port: 80
Document Path: /index.php
Document Length: 154 bytes
Concurrency Level: 10
Time taken for tests: 74.373 seconds
Complete requests: 1000
Failed requests: 0
Write errors: 0
Non-2xx responses: 1000
Total transferred: 330000 bytes
HTML transferred: 154000 bytes
/*大家最关心的指标之一,指的是吞吐率
相当于 LR 中的 每秒事务数 ,后面括号中的 mean 表示这是一个平均值*/
Requests per second: 13.45 [#/sec] (mean)
/*大家最关心的指标之二,指的是用户平均请求等待时间
相当于 LR 中的 平均事务响应时间 ,后面括号中的 mean 表示这是一个平均值*/
Time per request: 743.726 [ms] (mean)
/*大家最关心的指标之三,指的是服务器平均请求处理时间
Time per request: 74.373 [ms] (mean, across all concurrent requests)
Transfer rate: 4.33 [Kbytes/sec] received
Connection Times (ms)
min mean[+/-sd] median max
Connect: 129 163 245.3 145 3154
Processing: 129 576 1510.8 147 11756
Waiting: 129 567 1502.0 147 11756
Total: 261 739 1543.7 294 11888
Percentage of the requests served within a certain time (ms)
50% 294
66% 297
75% 304
80% 308
90% 1290
95% 3452
98% 7582
99% 7962
100% 11888 (longest request) |
4、为了使结果更有对比性,我们将并发用户更改为100个进行压力测试,我这里只将三个指标贴出来。
|
1
2
3 |
Requests per second: 190.95 [#/sec] (mean)
Time per request: 523.694 [ms] (mean)
Time per request: 5.237 [ms] (mean, across all concurrent requests) |
5、将并发用户改为200个进行测试
|
1
2
3 |
Requests per second: 186.00 [#/sec] (mean)
Time per request: 1149.433 [ms] (mean)
Time per request: 5.747 [ms] (mean, across all concurrent requests) |
6、500个并发用户时的情况
|
1
2
3 |
Requests per second: 180.99 [#/sec] (mean)
Time per request: 2631.662 [ms] (mean)
Time per request: 5.263 [ms] (mean, across all concurrent requests) |
我们来分析下测试的结果,先对比下吞吐率,当并发用户的时候吞吐率最高为190 reqs/s,当并发用户数为200,500 吞吐率下降了,随之用户的等待时间更是明显增加了,已经有2s的等待时间了。这说明性能明显下降了。当然分析这个测试结果并不是说明51CTO的网站的并发用户只能在500左右,因为我是在服务器负荷的情况下就行测试的,这显然不能说明问题。另外我们在生产环境下测试的时候,最好能将测试结果做成报表,这样可以非常清晰地对比出问题来,好了,我该准备下,给上面提交一份我们公司网站的测试报告了。

相关文章

- 服务器虚拟化技术深度科普 2025-05-27
- 服务器租用价格怎么计算?服务器租用多少钱一年? 2025-05-27
- 云服务器的“弹性”体现在哪些方面? 2025-05-27
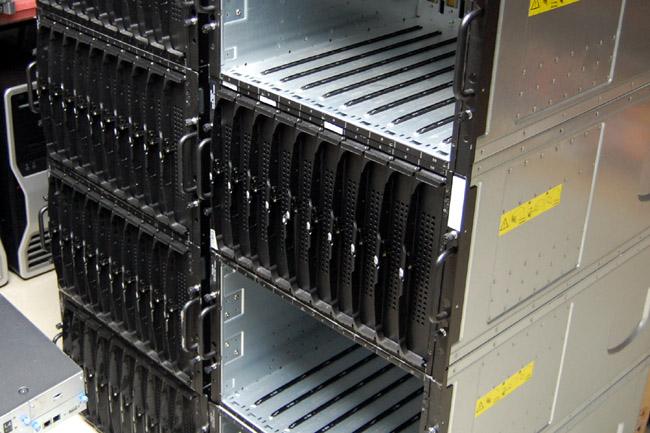
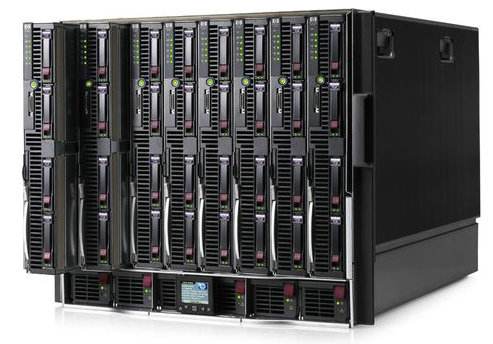
- 刀片服务器是什么 刀片服务器的主要特点 2025-05-27
- 利用FTP和计划任务自动备份网站数据和数据库 2025-05-27