

本文介绍SpringBoot如何使用Prometheus配合Grafana监控。
1.关于Prometheus
Prometheus是一个根据应用的metrics来进行监控的开源工具。相信很多工程都在使用它来进行监控,有关详细介绍可以查看官网:https://prometheus.io/docs/introduction/overview/。
2.有关Grafana
Grafana是一个开源监控利器,如图所示。
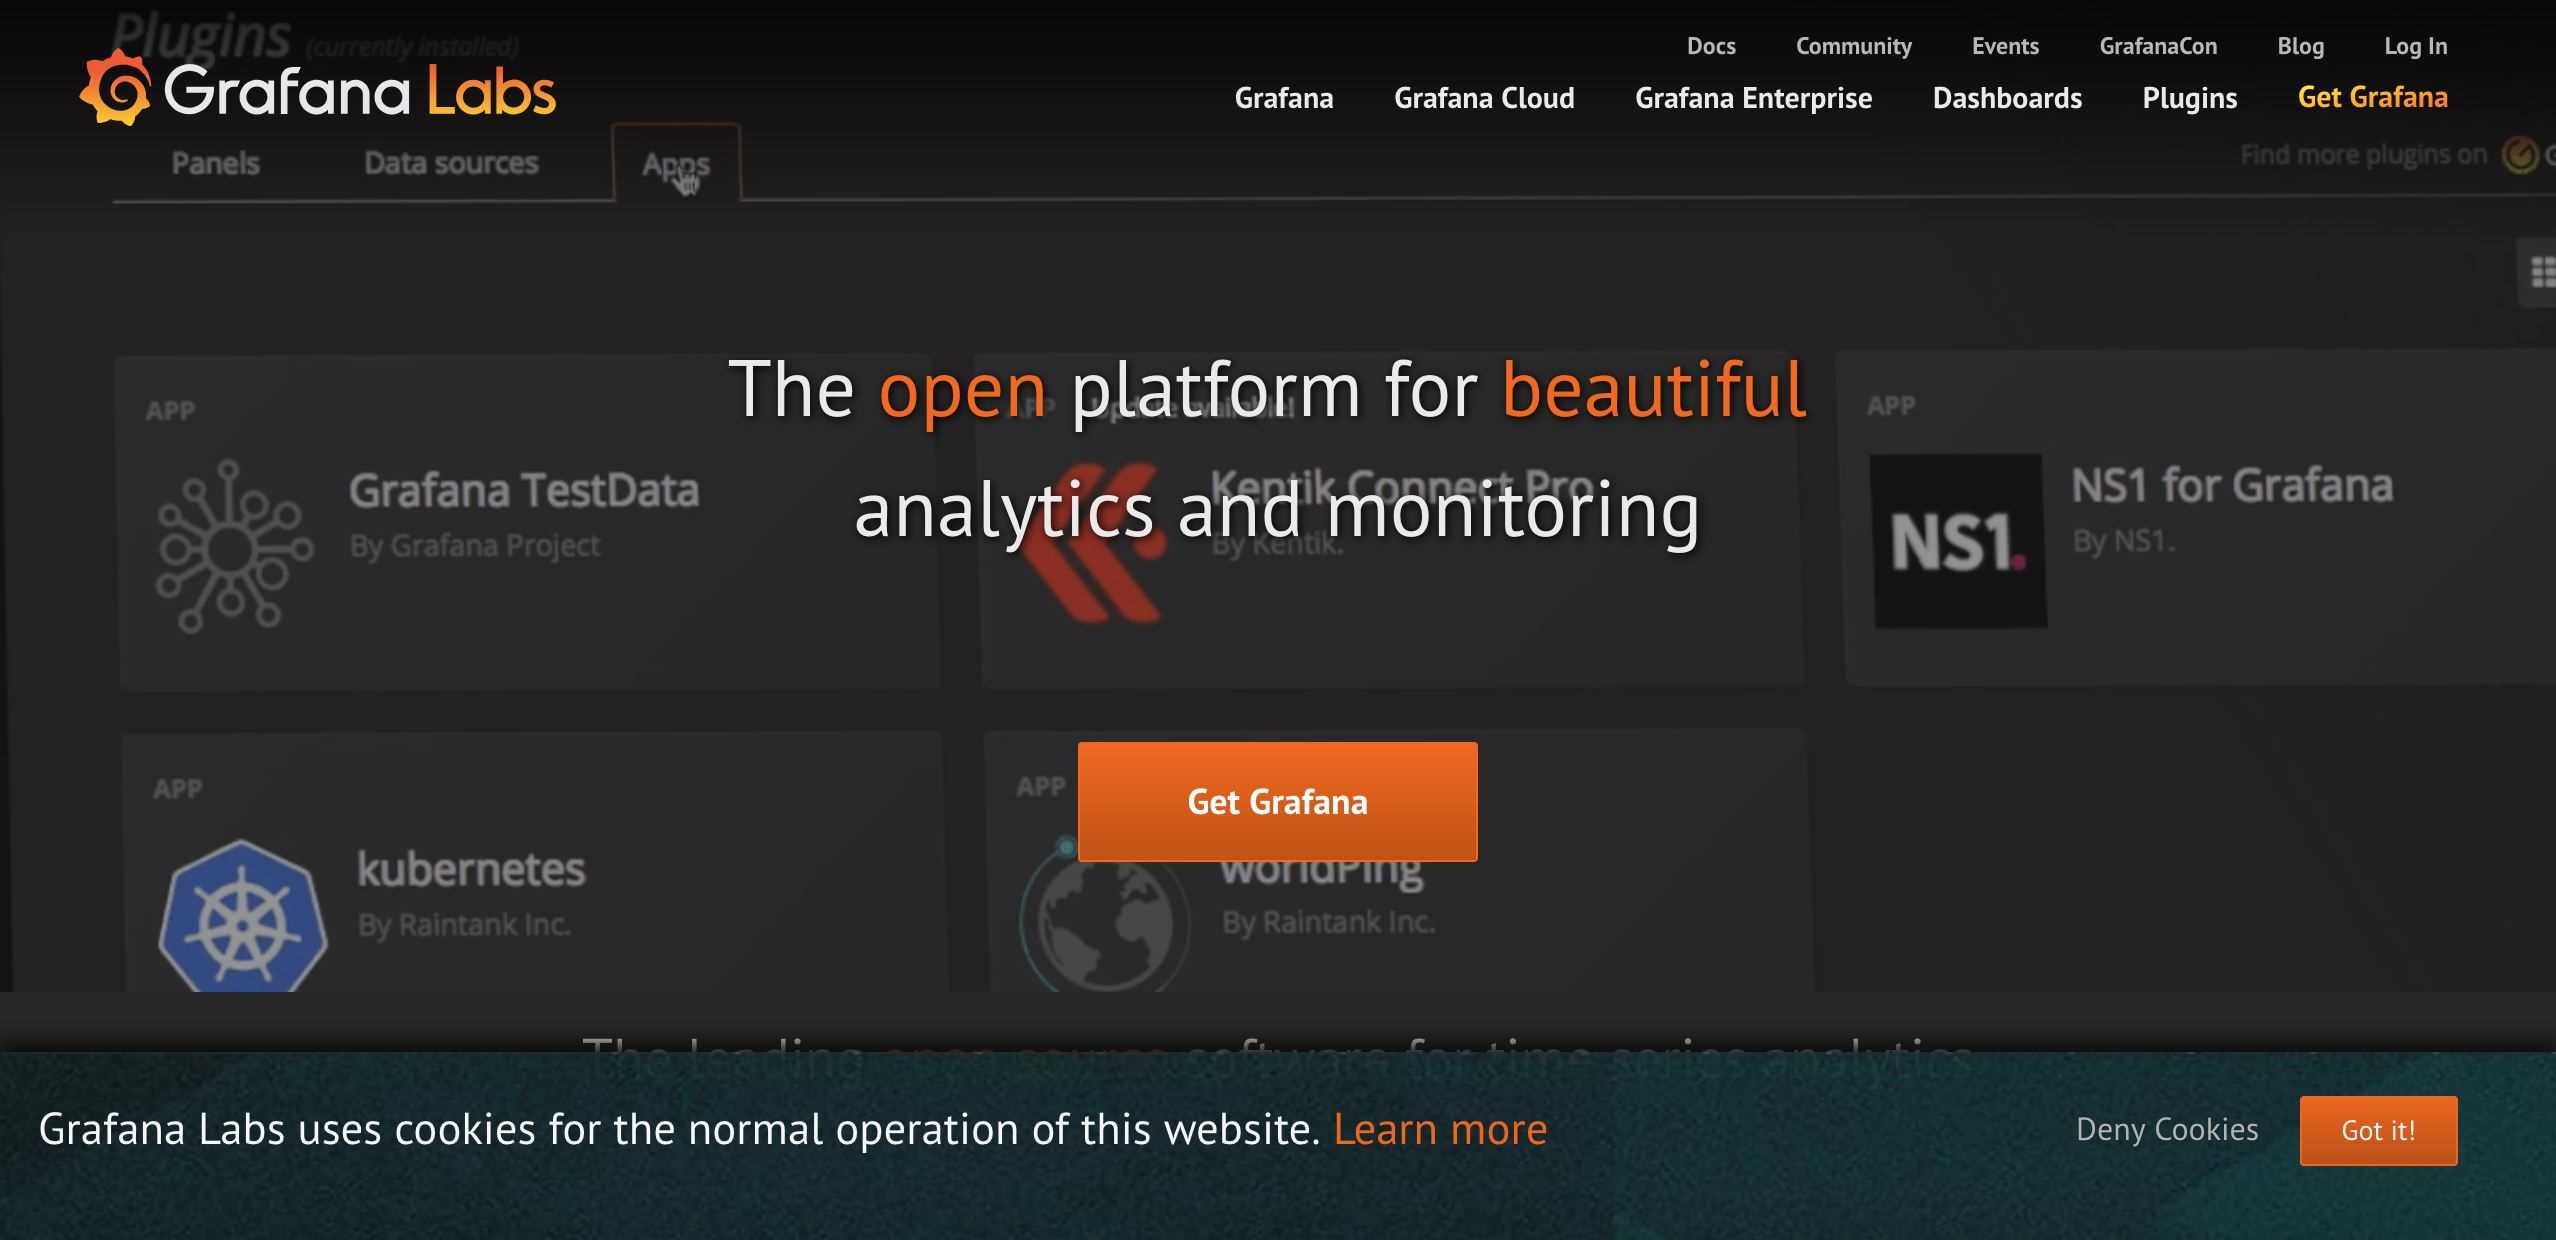
从图中就可以看出来,使用Grafana监控很高大上,提供了很多可视化的图标。
官网地址:https://grafana.com/
3.SpringBoot使用Prometheus
3.1 依赖内容
在SpringBoot中使用Prometheus其实很简单,不需要配置太多的东西,在pom文件中加入依赖,完整内容如下所示。
- <?xml version="1.0" encoding="UTF-8"?>
- <project xmlns="http://maven.apache.org/POM/4.0.0" xmlns:xsi="http://www.w3.org/2001/XMLSchema-instance"
- xsi:schemaLocation="http://maven.apache.org/POM/4.0.0 http://maven.apache.org/xsd/maven-4.0.0.xsd">
- <modelVersion>4.0.0</modelVersion>
- <parent>
- <groupId>org.springframework.boot</groupId>
- <artifactId>spring-boot-starter-parent</artifactId>
- <version>2.1.3.RELEASE</version>
- <relativePath/> <!– lookup parent from repository –>
- </parent>
- <groupId>com.dalaoyang</groupId>
- <artifactId>springboot2_prometheus</artifactId>
- <version>0.0.1-SNAPSHOT</version>
- <name>springboot2_prometheus</name>
- <description>springboot2_prometheus</description>
- <properties>
- <java.version>1.8</java.version>
- </properties>
- <dependencies>
- <dependency>
- <groupId>org.springframework.boot</groupId>
- <artifactId>spring-boot-starter-actuator</artifactId>
- </dependency>
- <dependency>
- <groupId>org.springframework.boot</groupId>
- <artifactId>spring-boot-starter-web</artifactId>
- </dependency>
- <dependency>
- <groupId>org.springframework.boot</groupId>
- <artifactId>spring-boot-starter-test</artifactId>
- <scope>test</scope>
- </dependency>
- <dependency>
- <groupId>io.micrometer</groupId>
- <artifactId>micrometer-registry-prometheus</artifactId>
- <version>1.1.3</version>
- </dependency>
- </dependencies>
- <build>
- <plugins>
- <plugin>
- <groupId>org.springframework.boot</groupId>
- <artifactId>spring-boot-maven-plugin</artifactId>
- </plugin>
- </plugins>
- </build>
- </project>
3.2 配置文件
配置文件中加入配置,这里就只进行一些简单配置,management.metrics.tags.application属性是本文配合Grafana的Dashboard设置的,如下所示:
- spring.application.name=springboot_prometheus
- management.endpoints.web.exposure.include=*
- management.metrics.tags.application=${spring.application.name}
3.3 设置application
修改启动类,如下所示.
- @SpringBootApplication
- public class Springboot2PrometheusApplication {
- public static void main(String[] args) {
- SpringApplication.run(Springboot2PrometheusApplication.class, args);
- }
- @Bean
- MeterRegistryCustomizer<MeterRegistry> configurer(
- @Value("${spring.application.name}") String applicationName) {
- return (registry) -> registry.config().commonTags("application", applicationName);
- }
- }
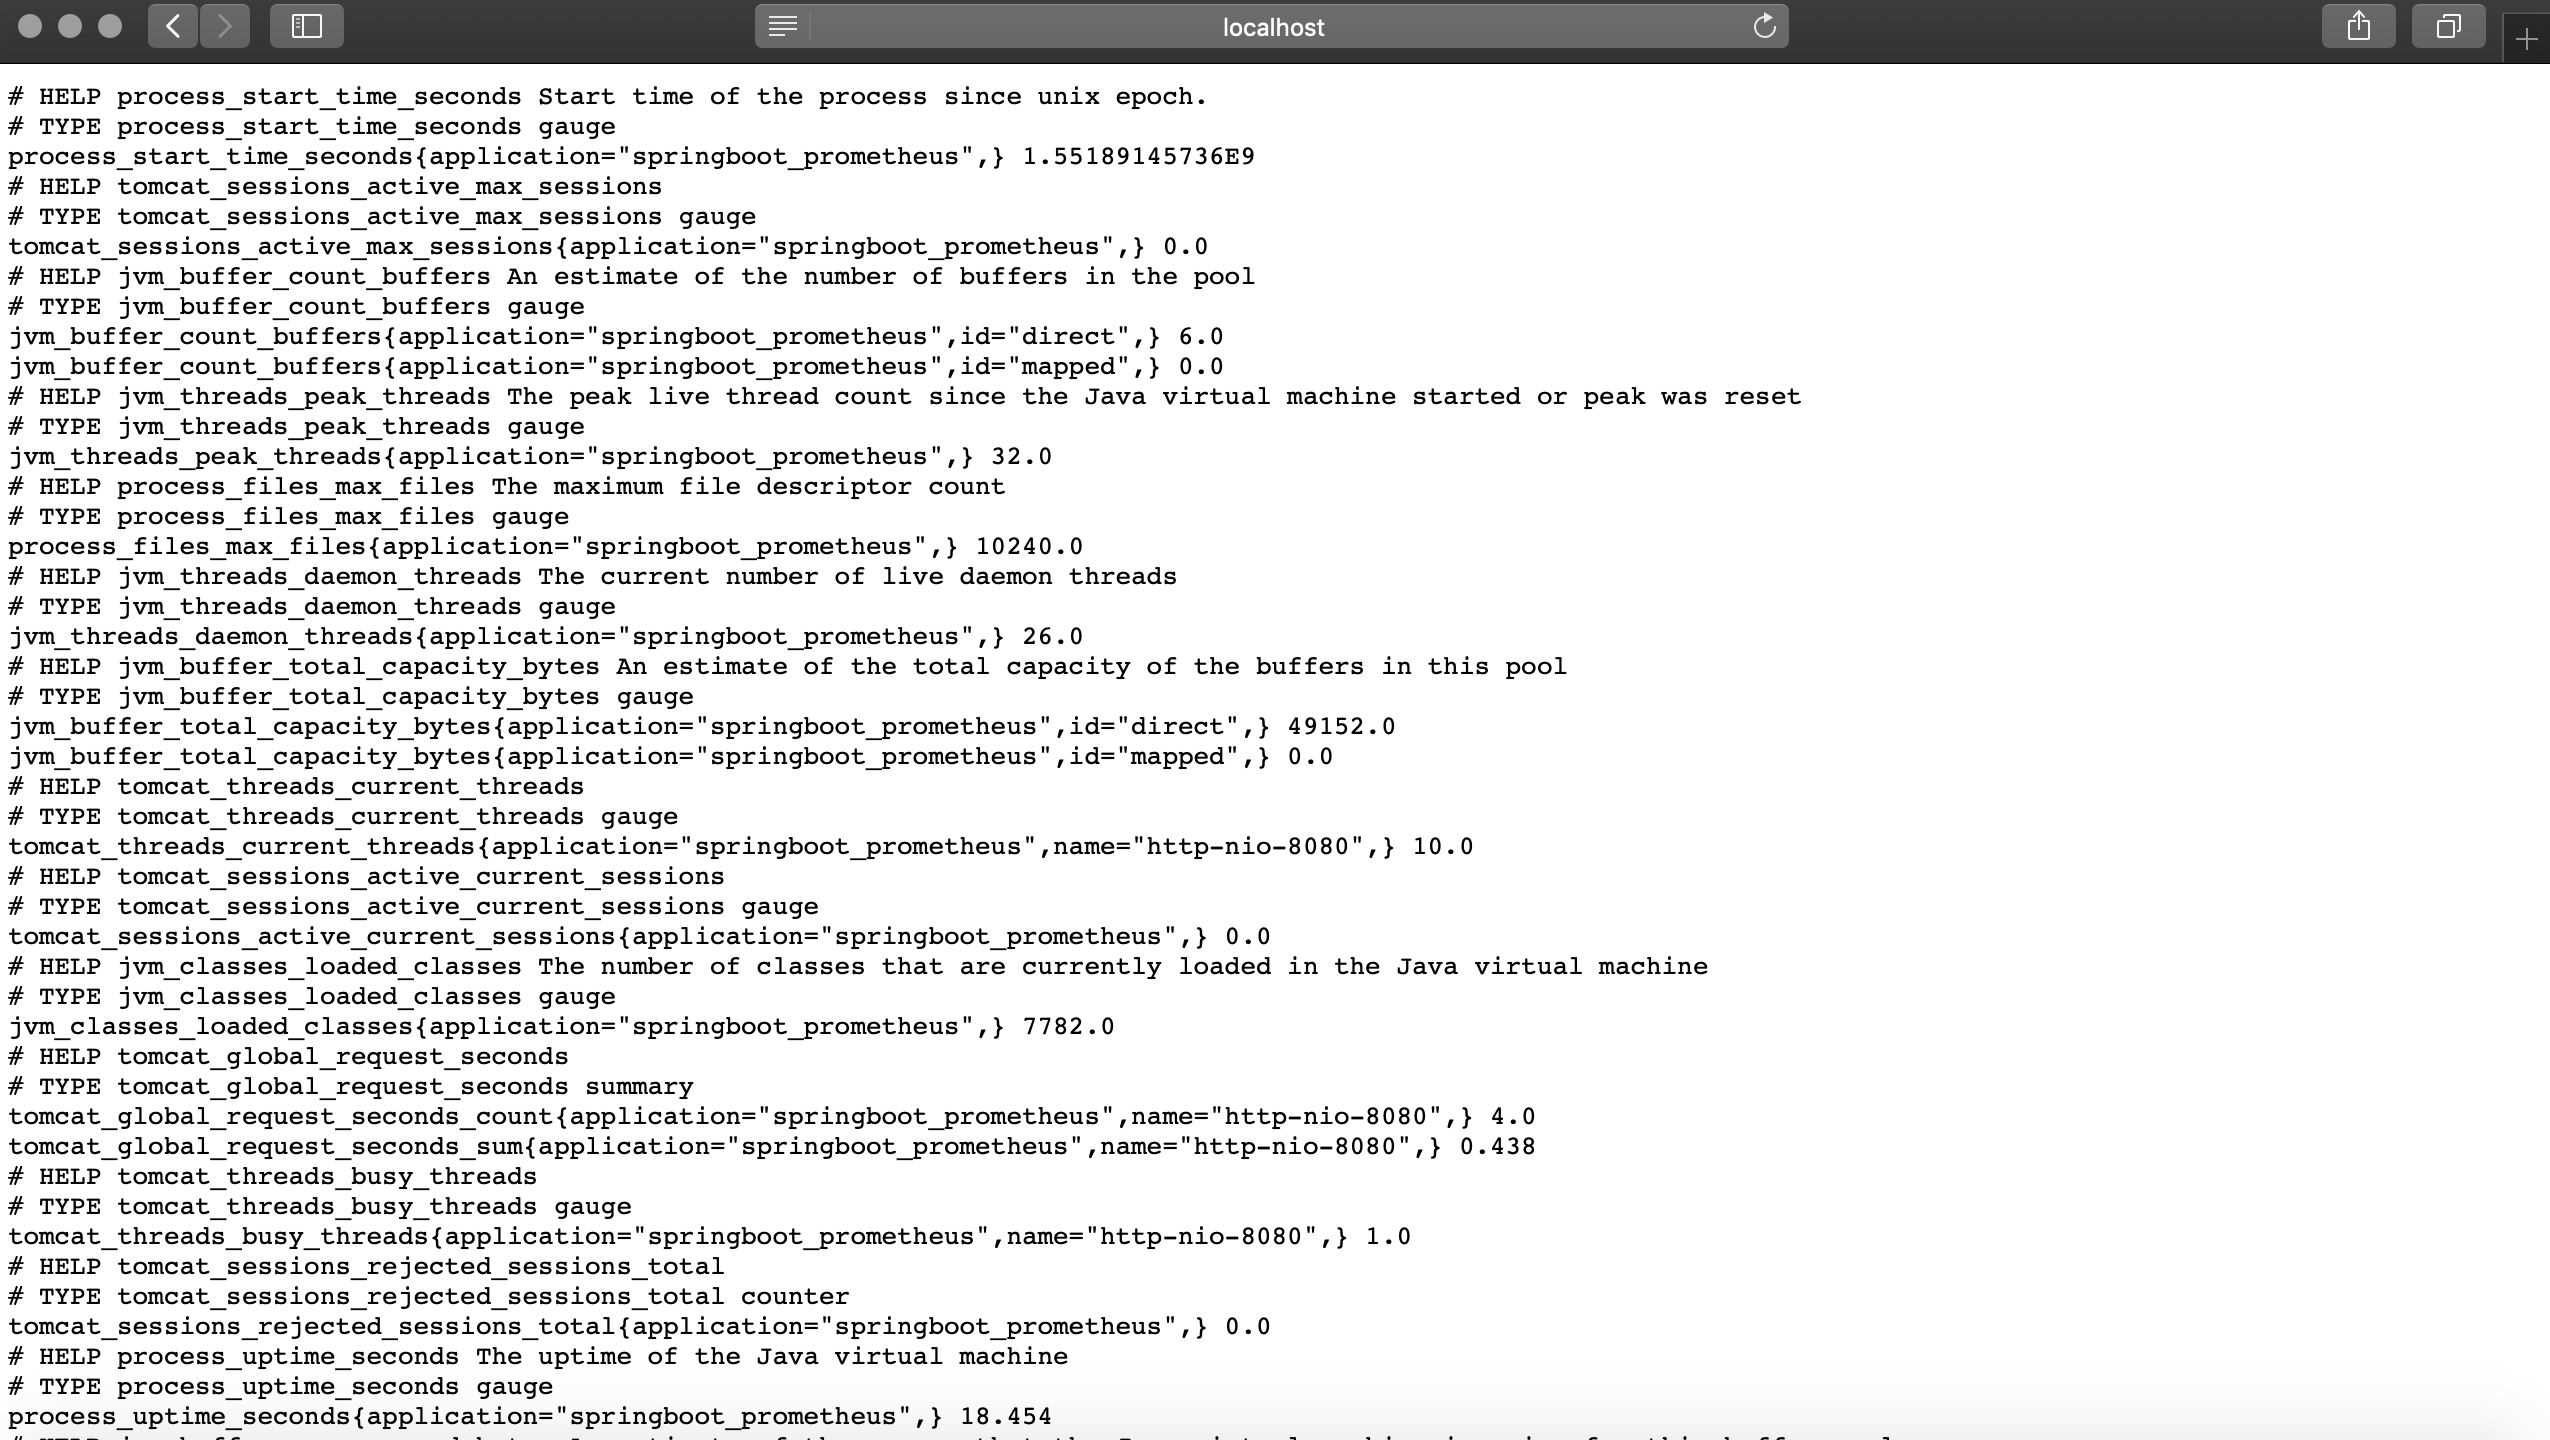
SpringBoot项目到这里就配置完成了,启动项目,访问http://localhost:8080/actuator/prometheus,如图所示,可以看到一些度量指标。
4.Prometheus配置
4.1 配置应用
在prometheus配置监控我们的SpringBoot应用,完整配置如下所示。
- # my global config
- global:
- scrape_interval: 15s # Set the scrape interval to every 15 seconds. Default is every 1 minute.
- evaluation_interval: 15s # Evaluate rules every 15 seconds. The default is every 1 minute.
- # scrape_timeout is set to the global default (10s).
- # Alertmanager configuration
- alerting:
- alertmanagers:
- – static_configs:
- – targets:
- # – alertmanager:9093
- # Load rules once and periodically evaluate them according to the global 'evaluation_interval'.
- rule_files:
- # – "first_rules.yml"
- # – "second_rules.yml"
- # A scrape configuration containing exactly one endpoint to scrape:
- # Here it's Prometheus itself.
- scrape_configs:
- – job_name: 'prometheus'
- static_configs:
- – targets: ['127.0.0.1:9090']
- ###以下内容为SpringBoot应用配置
- – job_name: 'springboot_prometheus'
- scrape_interval: 5s
- metrics_path: '/actuator/prometheus'
- static_configs:
- – targets: ['127.0.0.1:8080']
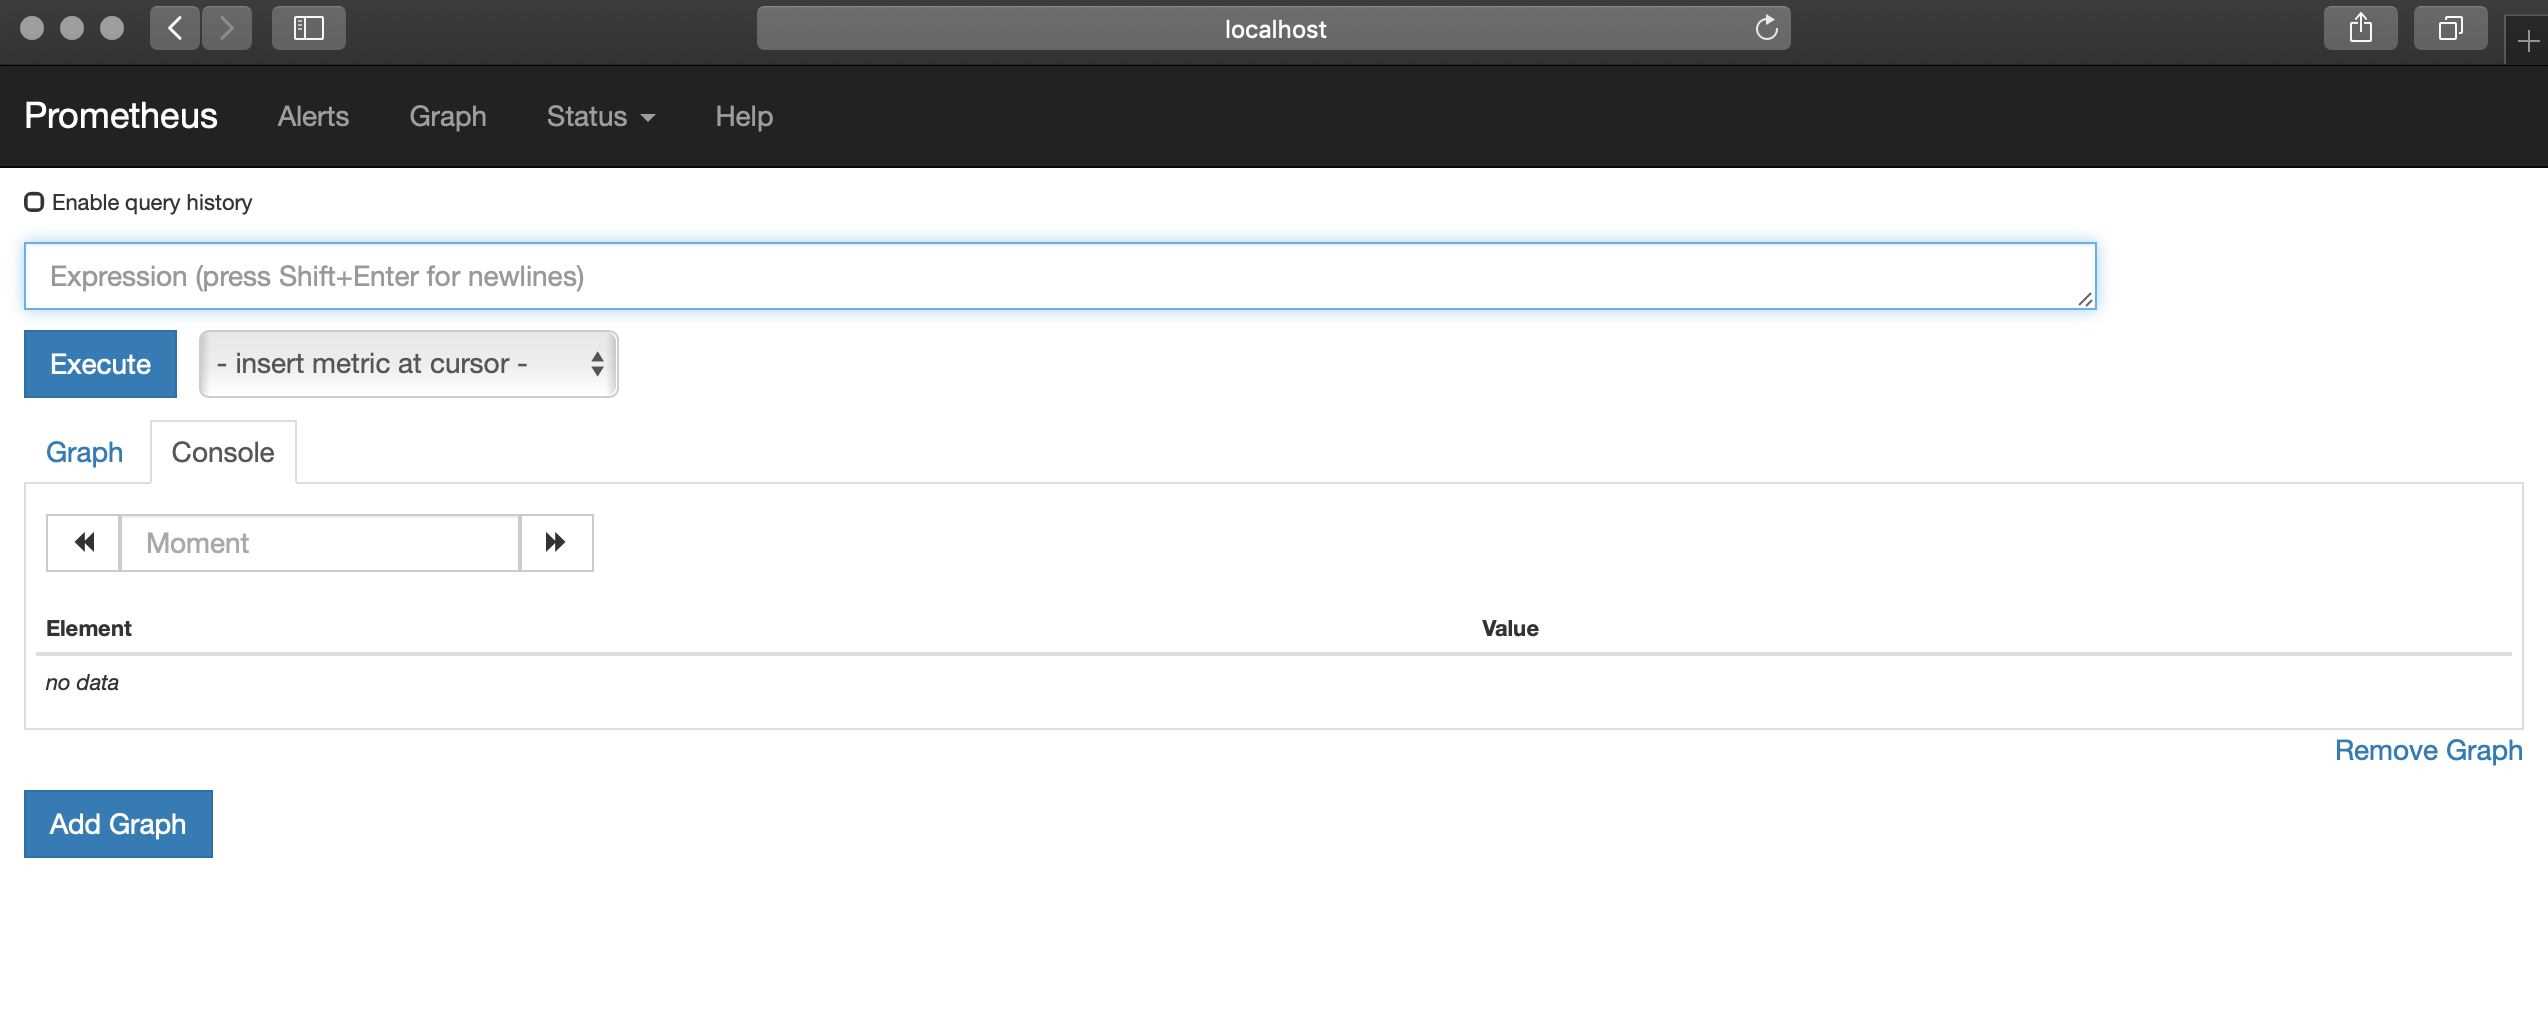
4.2 启动Prometheus
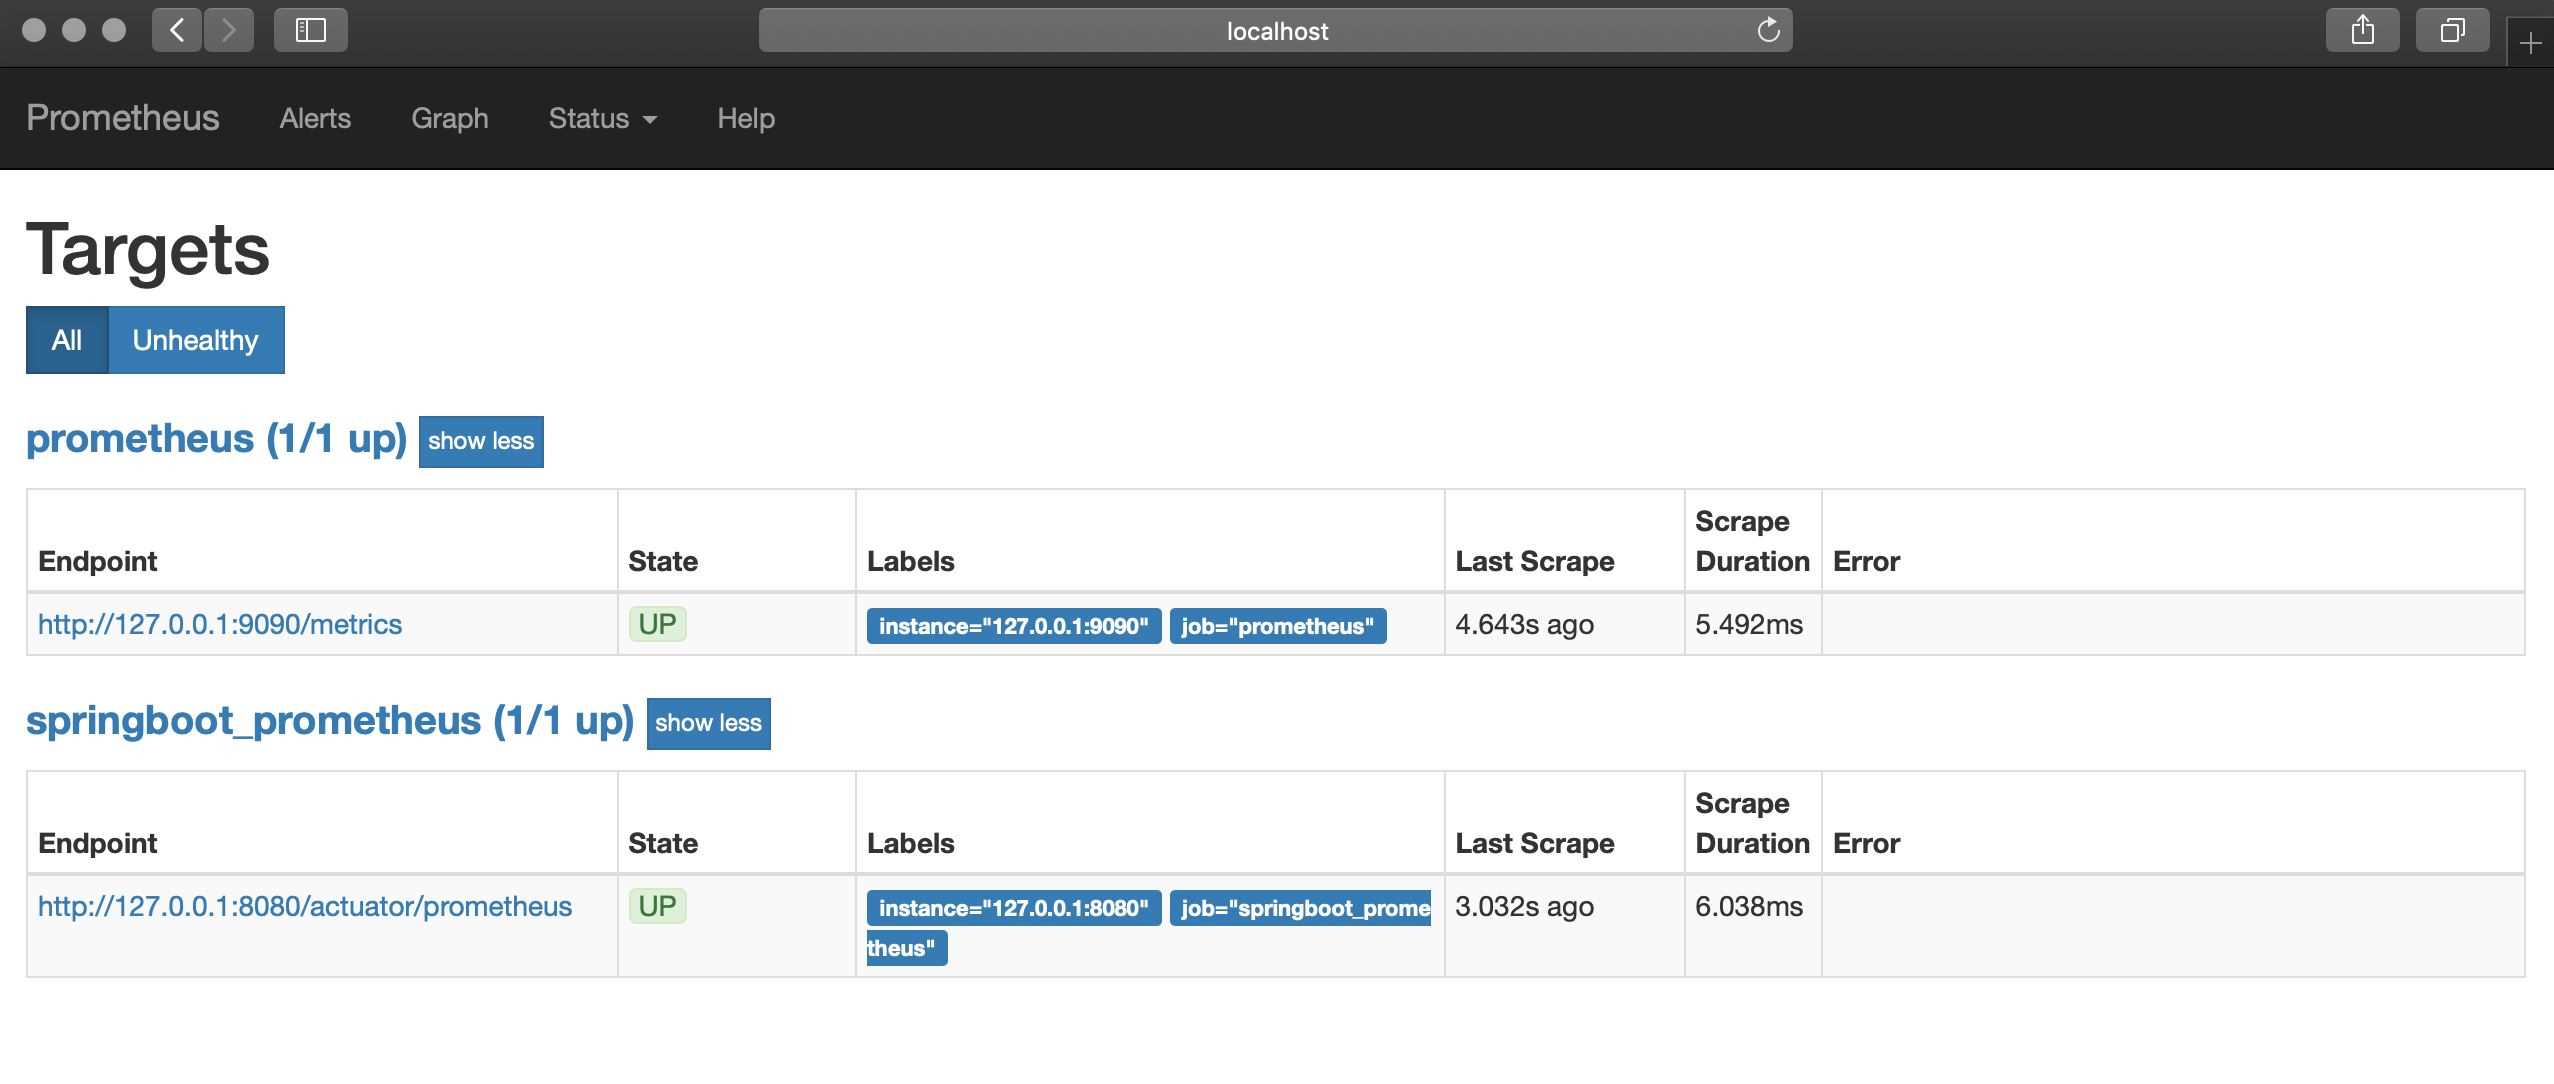
启动Prometheus,浏览器访问,查看Prometheus页面,如图所示。
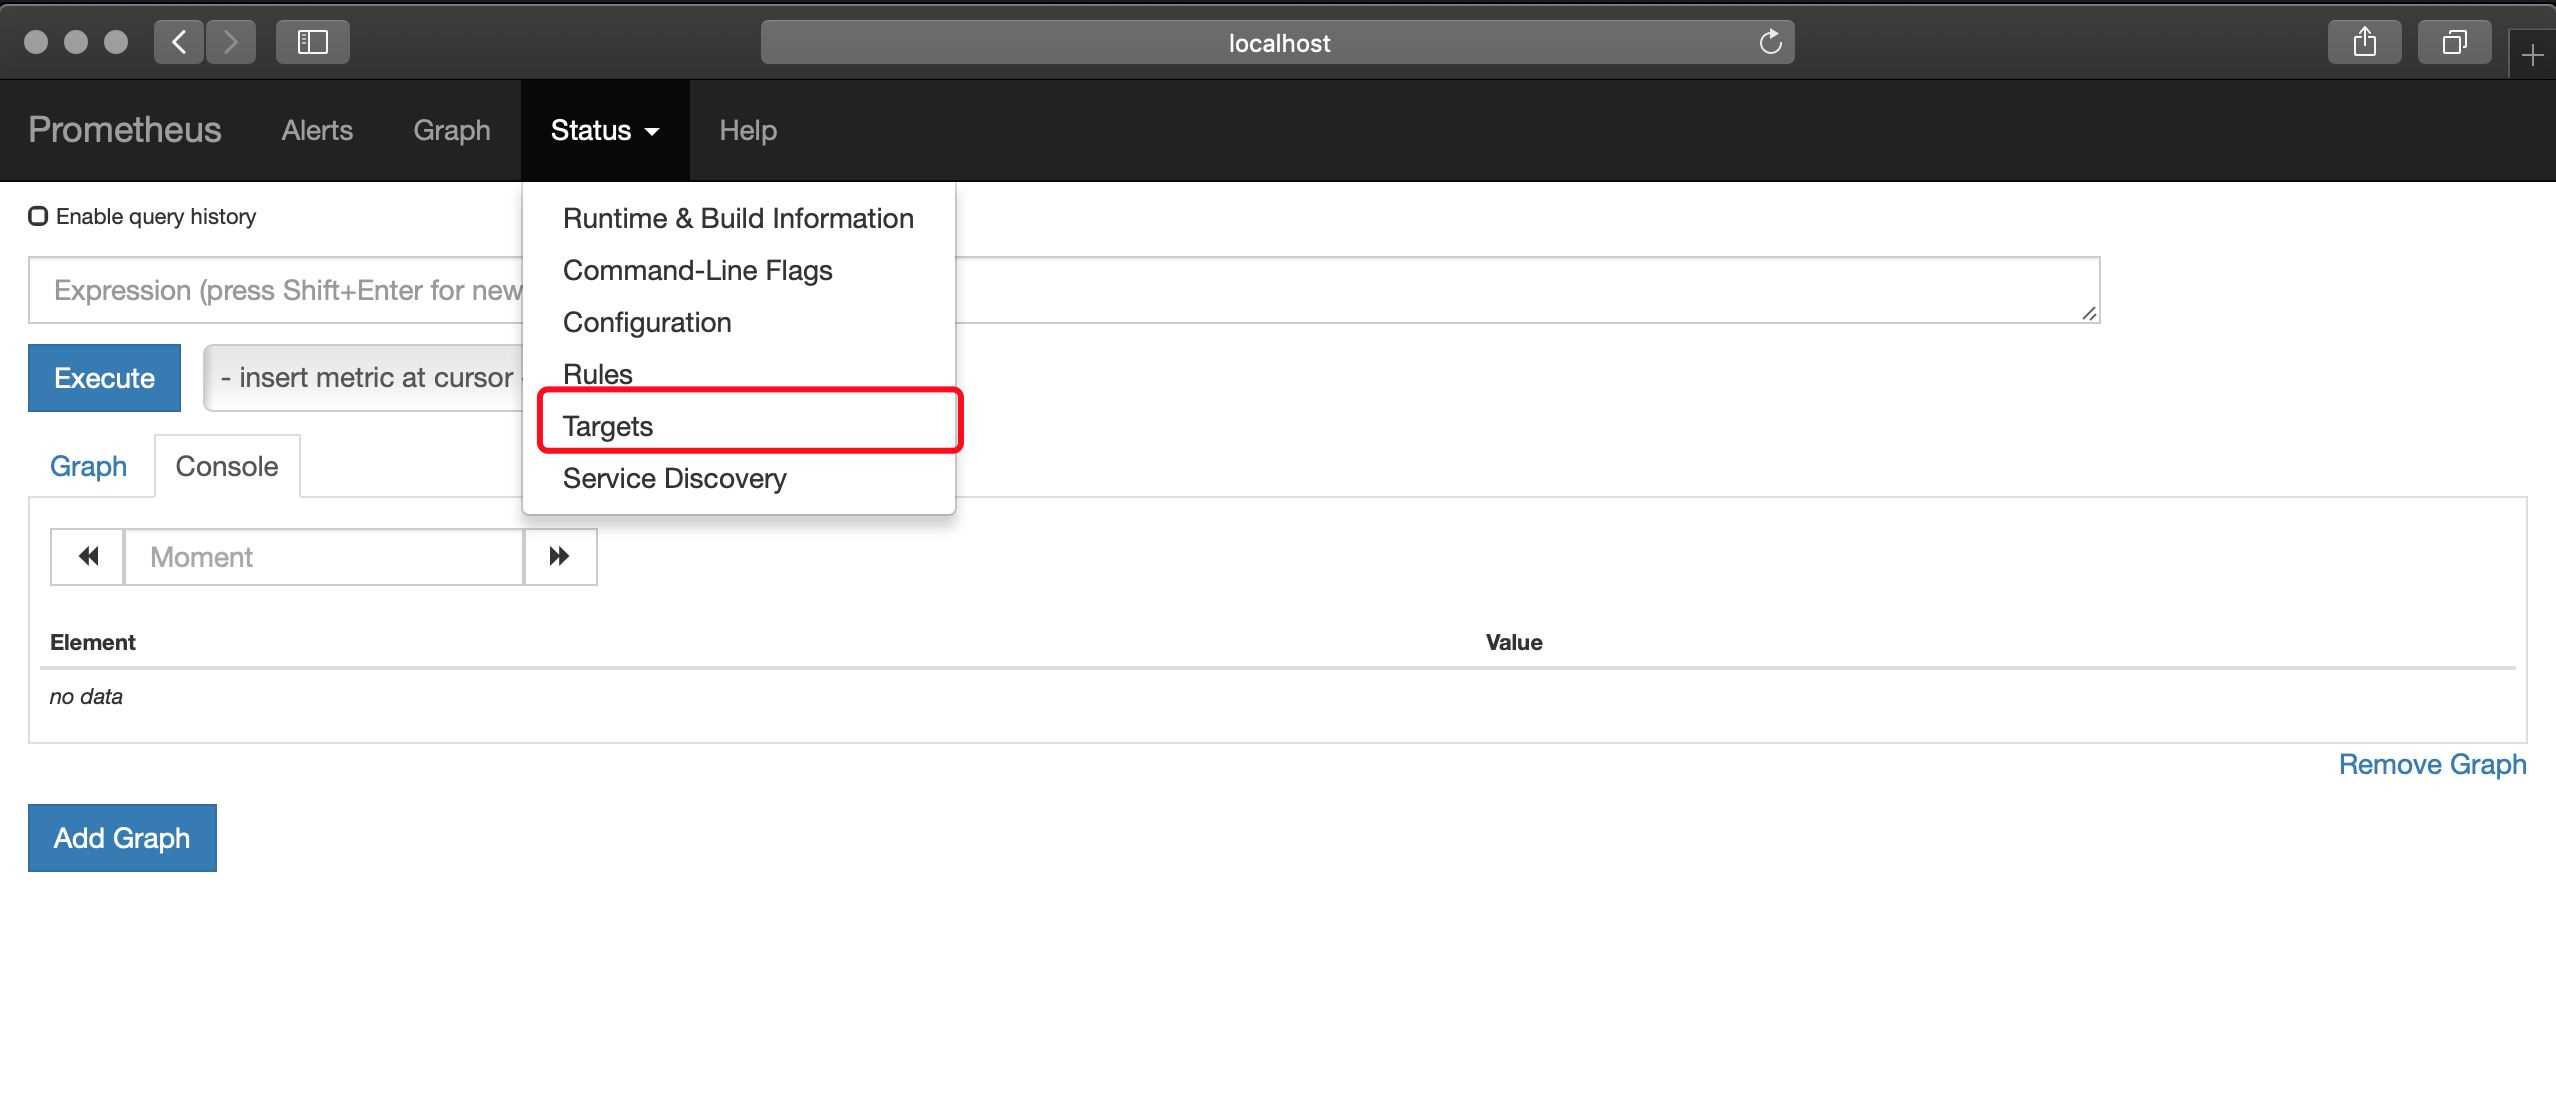
点击如图所示位置,可以查看Prometheus监控的应用。
列表中UP的页面为存活的实例,如图所示。
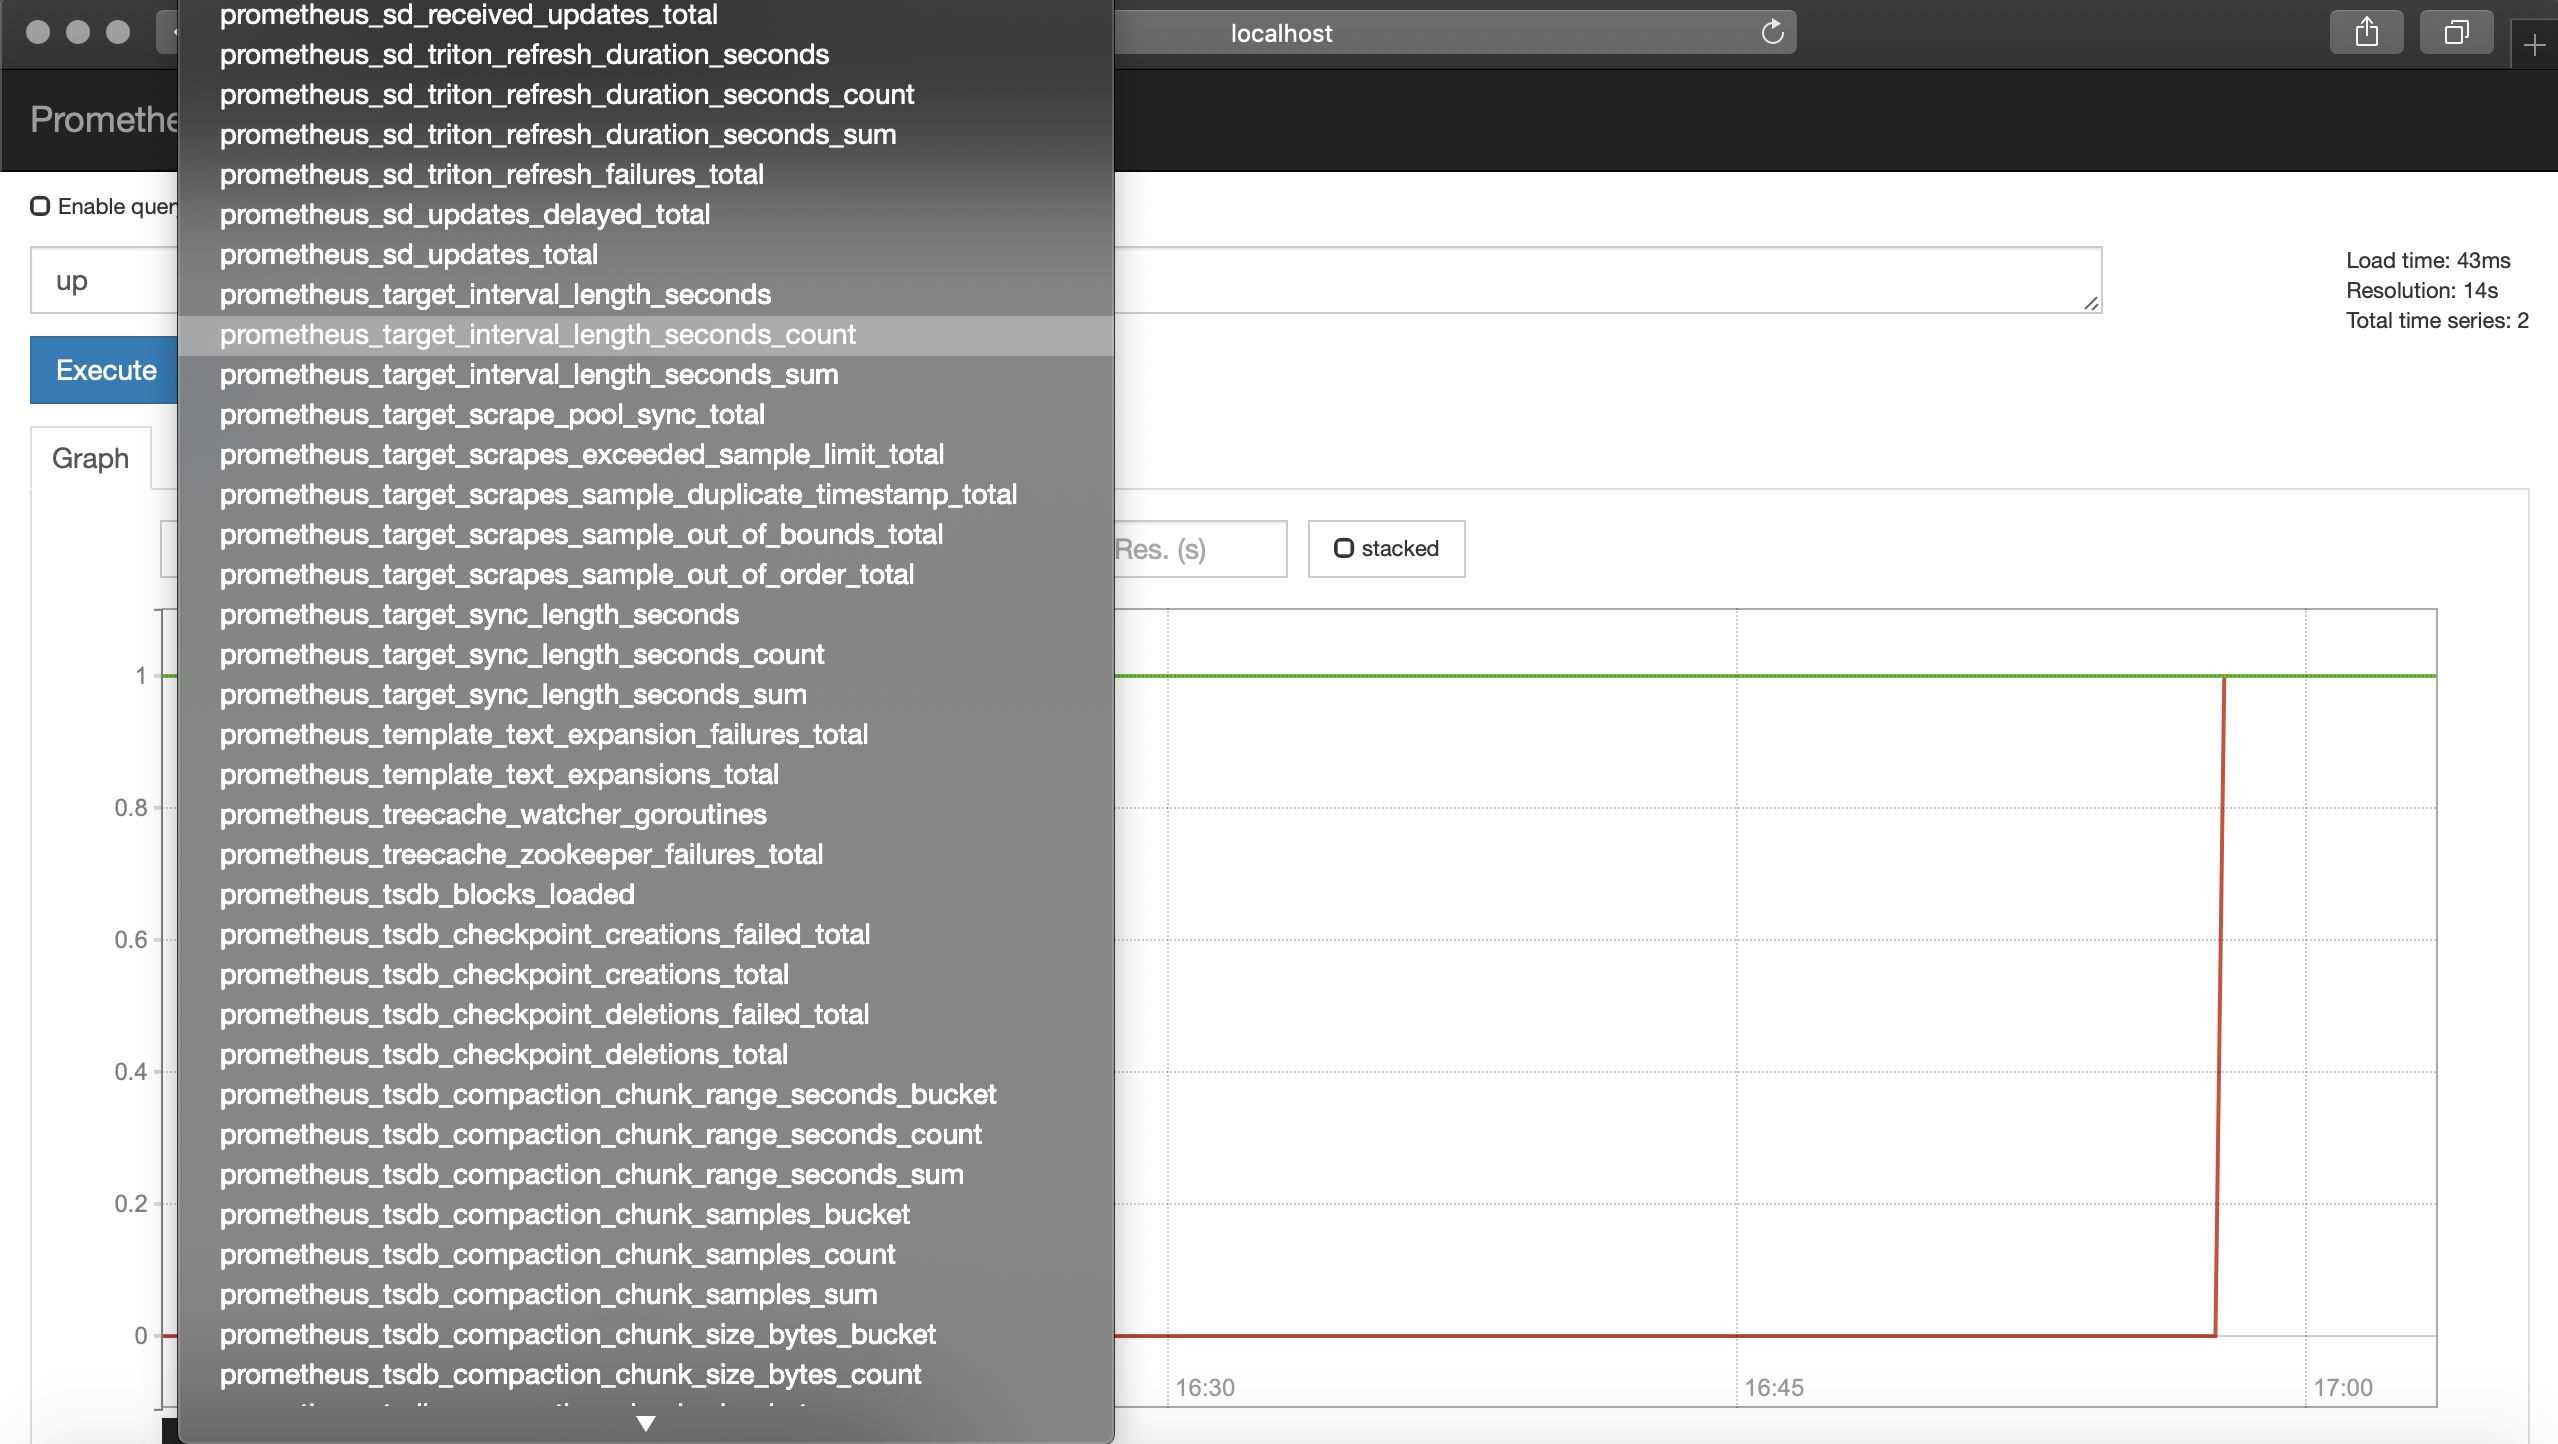
也可以查看很多指数,如下所示。
5.Grafana配置
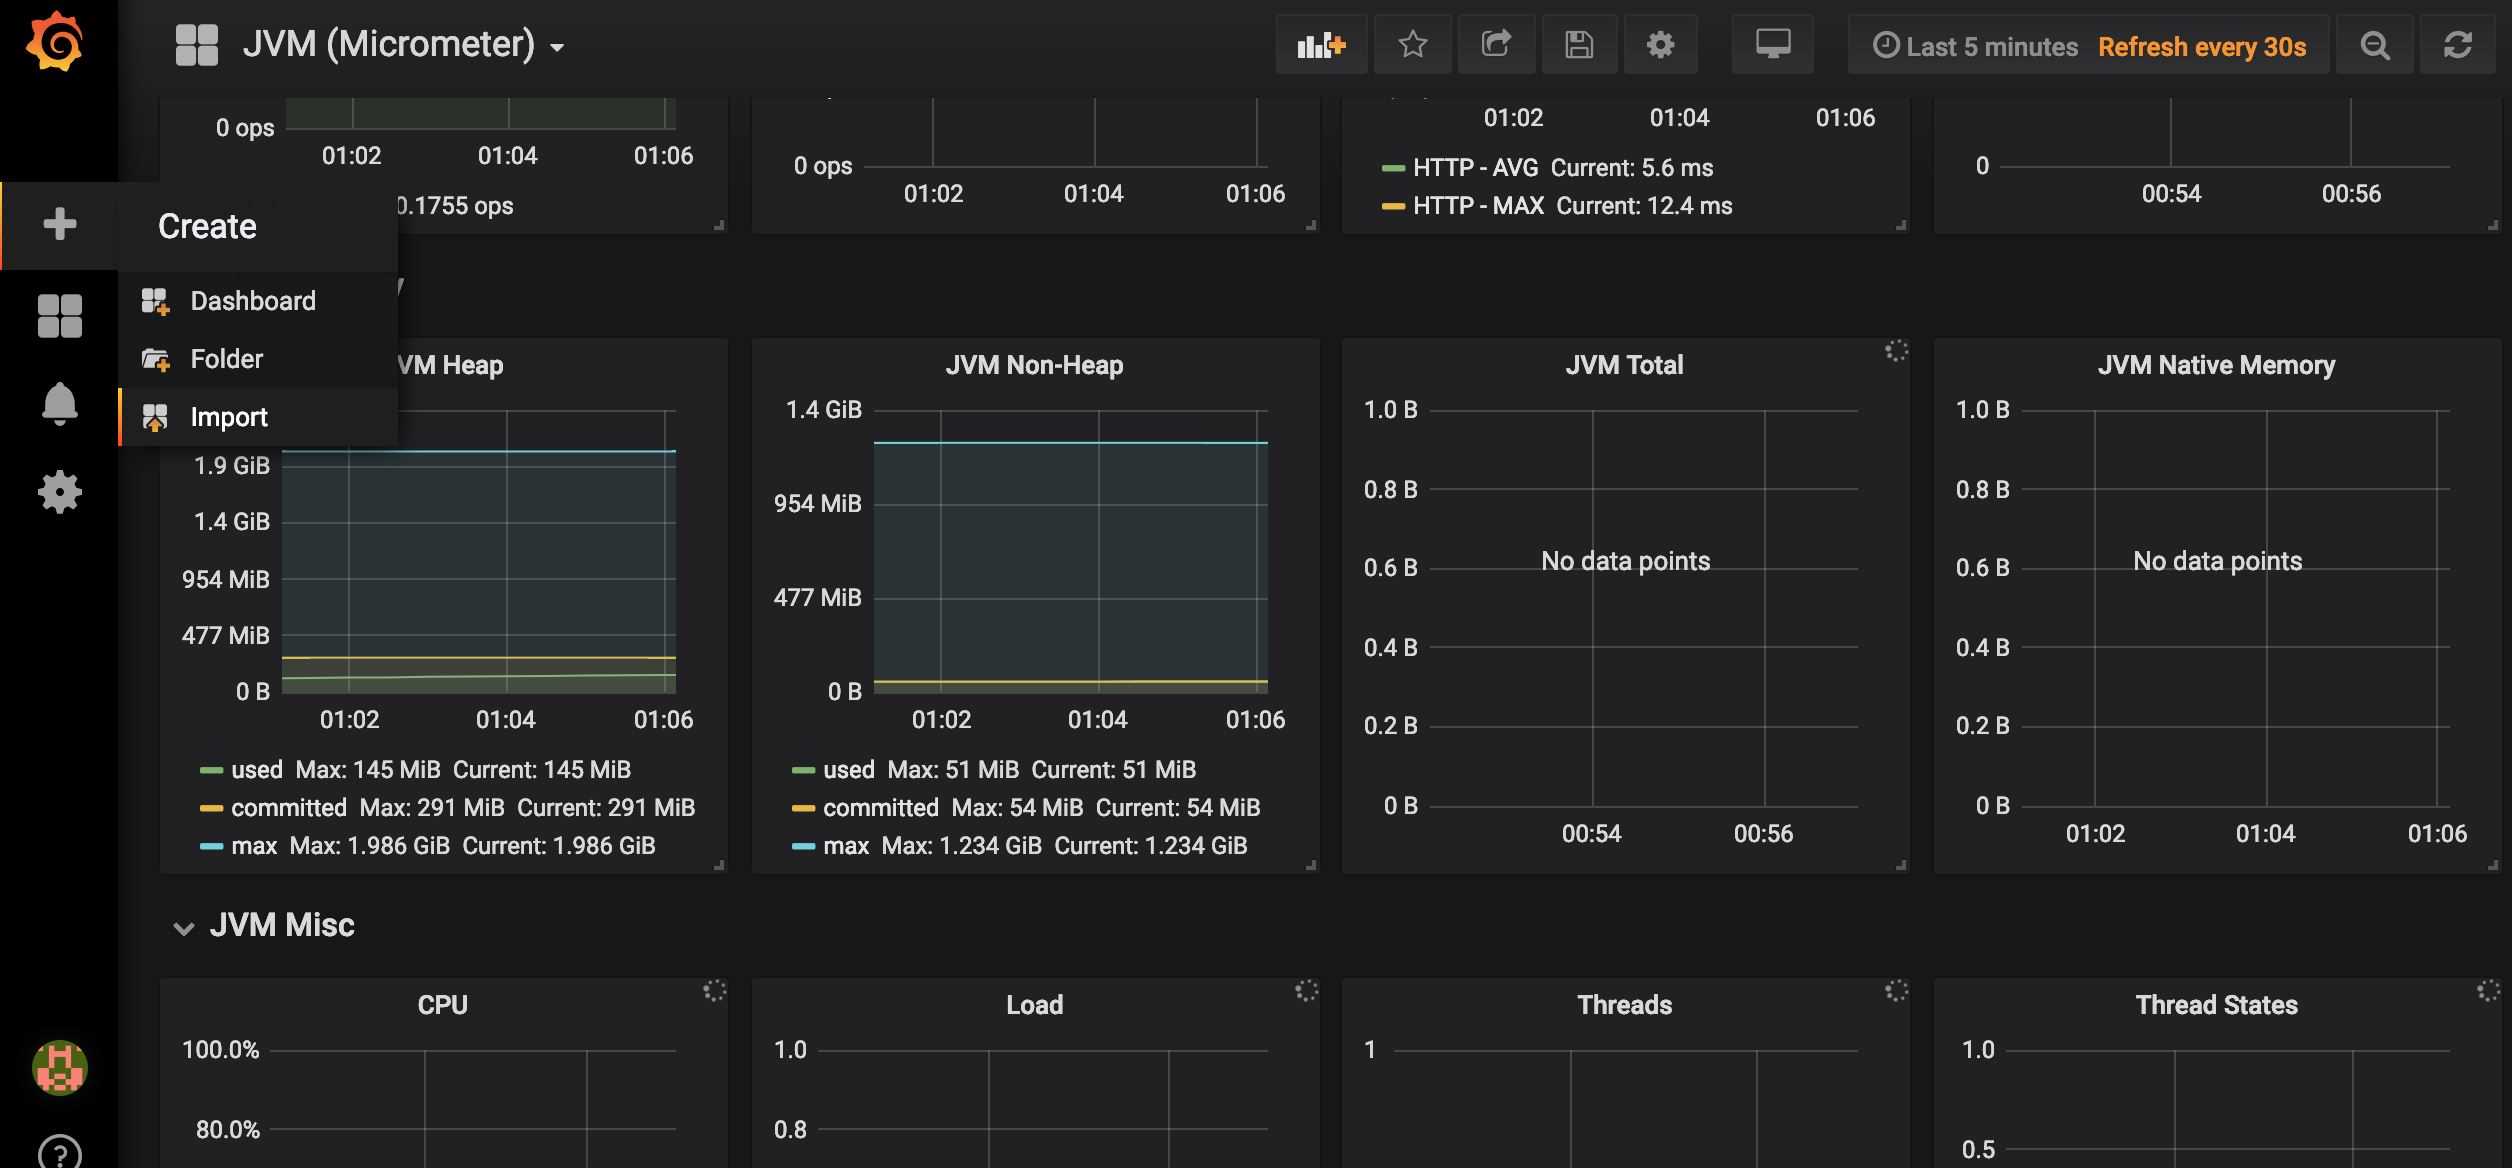
启动Grafana,配置Prometheus数据源,这里以ID是4701的Doshboard为例(地址:https://grafana.com/dashboards/4701)如图。

在Grafana内点击如图所示import按钮
在如图所示位置填写4701,然后点击load。
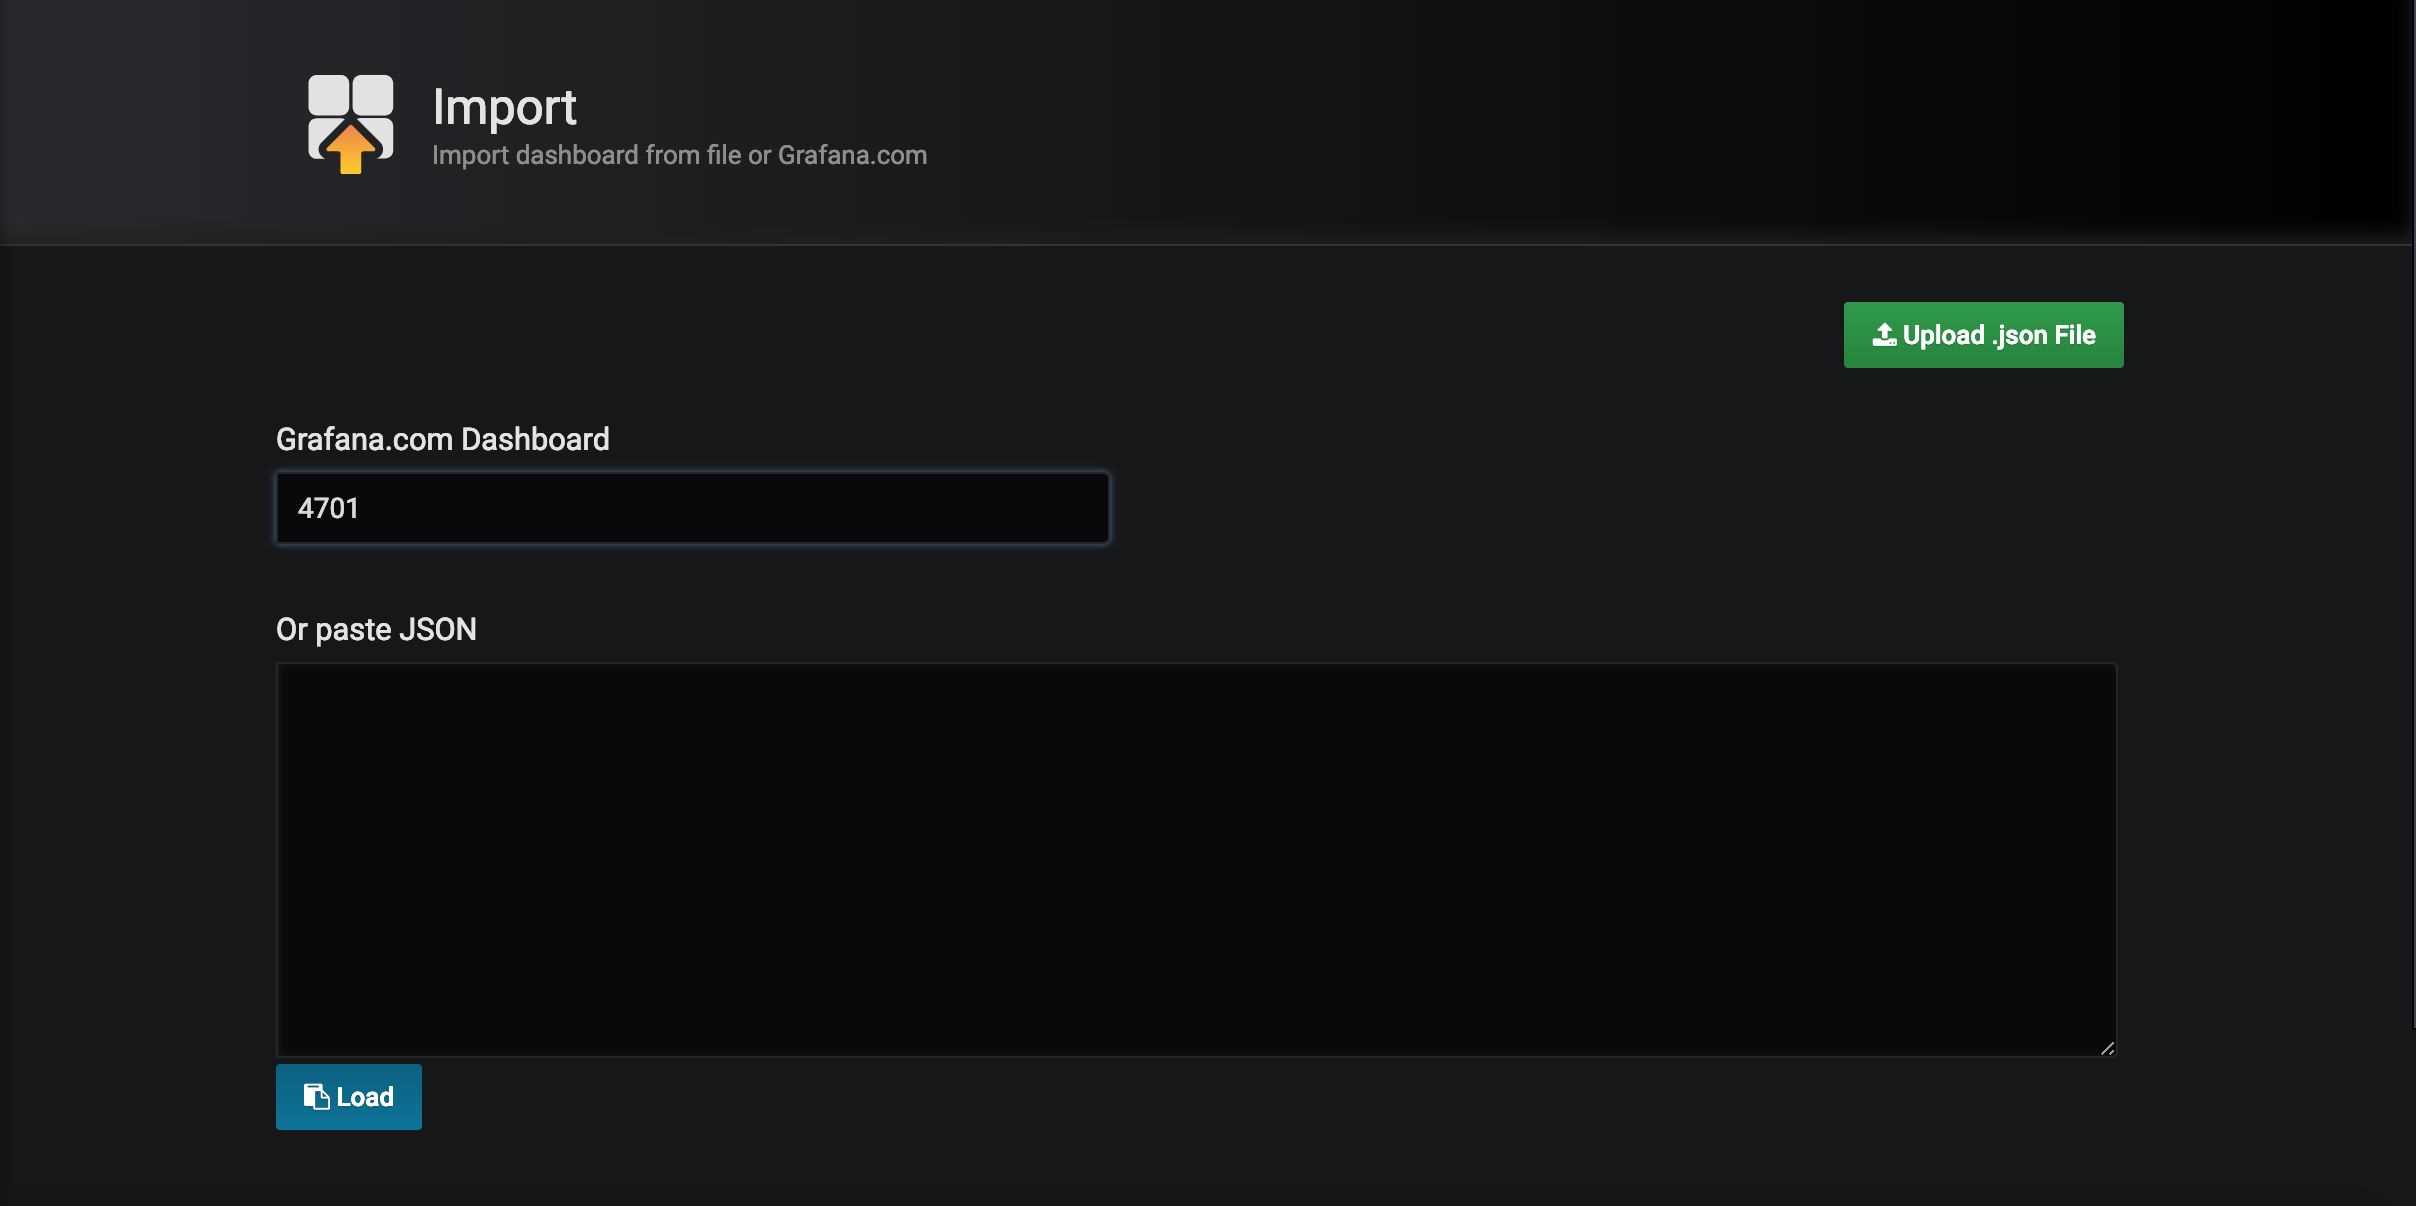
接下来导入Doshboard。
导入后就可以看到我们的SpringBoot项目对应的指标图表了,如图。
6.源码
源码地址:https://gitee.com/dalaoyang/springboot_learn/tree/master/springboot2_prometheus
到此这篇关于SpringBoot使用prometheus监控的示例代码的文章就介绍到这了,更多相关SpringBoot prometheus监控内容请搜索快网idc以前的文章或继续浏览下面的相关文章希望大家以后多多支持快网idc!
原文链接:https://blog.csdn.net/qq_33257527/article/details/88294016