

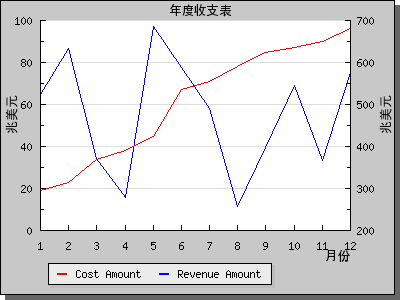
本文实例讲述了php使用Jpgraph绘制复杂X-Y坐标图的方法。分享给大家供大家参考。具体实现方法如下:
?
|
1
2
3
4
5
6
7
8
9
10
11
12
13
14
15
16
17
18
19
20
21
22
23
24
25
26
27
28
29
30
|
<?php
include ("src/jpgraph.php");
include ("src/jpgraph_line.php");
$data1 = array(19,23,34,38,45,67,71,78,85,87,90,96); //第一条曲线的数组
$data2 = array(523,634,371,278,685,587,490,256,398,545,367,577); //第二条曲线的数组
$graph = new Graph(400,300); //创建新的Graph对象
$graph->SetScale("textlin");
$graph->SetY2Scale("lin");
$graph->SetShadow(); //设置图像的阴影样式
$graph->img->SetMargin(40,50,20,70); //设置图像边距
$graph->title->Set("年度收支表"); //设置图像标题
$lineplot1=new LinePlot($data1); //创建设置两条曲线对象
$lineplot2=new LinePlot($data2);
$graph->Add($lineplot1); //将曲线放置到图像上
$graph->AddY2($lineplot2);
$graph->xaxis->title->Set("月份"); //设置坐标轴名称
$graph->yaxis->title->Set("兆美元");
$graph->y2axis->title->Set("兆美元");
$graph->title->SetFont(FF_SIMSUN,FS_BOLD); //设置字体
$graph->yaxis->title->SetFont(FF_SIMSUN,FS_BOLD);
$graph->y2axis->title->SetFont(FF_SIMSUN,FS_BOLD);
$graph->xaxis->title->SetFont(FF_SIMSUN,FS_BOLD);
$lineplot1->SetColor("red"); //设置颜色
$lineplot2->SetColor("blue");
$lineplot1->SetLegend("Cost Amount"); //设置图例名称
$lineplot2->SetLegend("Revenue Amount");
$graph->legend->SetLayout(LEGEND_HOR); //设置图例样式和位置
$graph->legend->Pos(0.4,0.95,"center","bottom");
$graph->Stroke(); //输出图像
?>
|

相关文章


猜你喜欢
- ASP.NET自助建站系统的数据库备份与恢复操作指南 2025-06-10
- 个人网站服务器域名解析设置指南:从购买到绑定全流程 2025-06-10
- 个人网站搭建:如何挑选具有弹性扩展能力的服务器? 2025-06-10
- 个人服务器网站搭建:如何选择适合自己的建站程序或框架? 2025-06-10
- 64M VPS建站:能否支持高流量网站运行? 2025-06-10